Figures & data
Figure 1. PC-12 cell inflammatory damage was triggered by LPS. Followed by different dosages of LPS stimulation (A) PC-12 cell viability, (B) cell apoptosis, (C) p53, Caspase 3, Cytochrome-C protein level, (D) IL-6, IL-8, TNF-α mRNA levels, and (E) IL-6, IL-8, TNF-α protein levels were tested, respectively. *p < .05, **p < .01, ***p < .001.
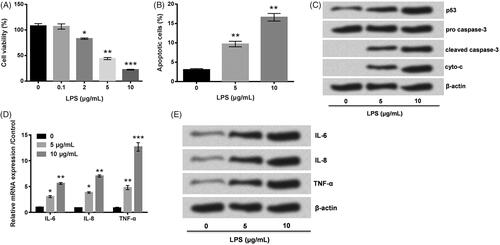
Figure 2. NGR1 weakened PC-12 cell inflammatory damage triggered by LPS. Followed by different dosages of NGR1 and/or LPS incubation, (A and B) cell viability (C) apoptosis, (D) p53, Caspase 3, Cytochrome-C protein levels, (E) IL-6, IL-8, TNF-α mRNA level, and (F) IL-6, IL-8, TNF-α protein level were assessed. *p < .05, **p < .01, ***p < .001.
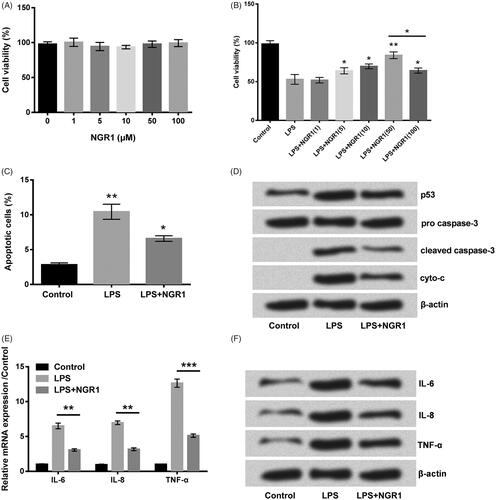
Figure 3. NGR1 weakened LPS-triggered PC-12 cell inflammation damage via elevating miR-132. (A) Followed by LPS and/or NGR1 stimulation, miR-132 expression was measured. (B) Transfection efficiency of miR-132 inhibitor was tested. Followed by LPS and/or NGR1 stimulation or miR-132 inhibitor transfection, (C) cell viability, (D) apoptosis, (E) p53, Caspase 3, Cytochrome-C protein levels, (F) IL-6, IL-8, TNF-α mRNA levels, and (G) IL-6, IL-8, TNF-α protein levels were analyzed. *p < .05, **p < .01.
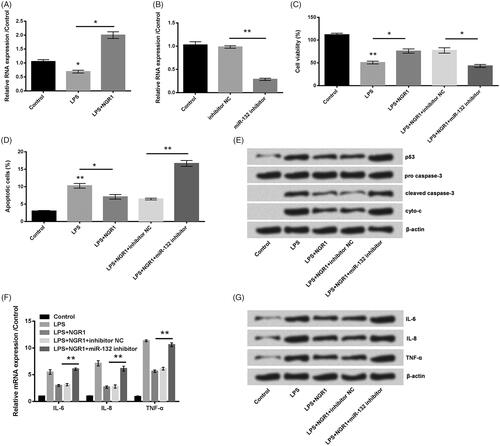
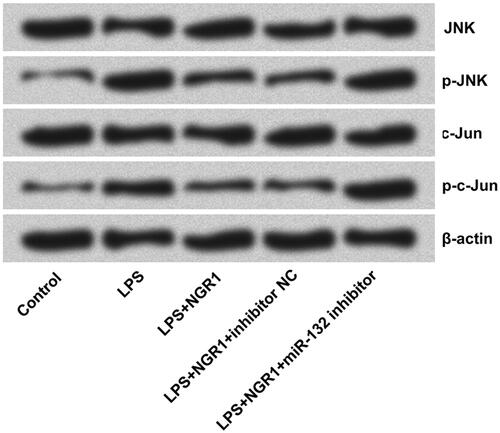
Figure 4. NGR1 inhibited activation of JNKsignalling pathway in LPS-injured PC-12 cells by elevating miR-132. Followed by LPS and/or NGR1 stimulation or miR-132 inhibitor transfection, the expressions of protein-related to JNK pathway were evaluated.