Figures & data
Figure 1. A scanning electron microscope (SEM) image of biogenic Zn NPs produced with a green microwave-assisted synthesis using L. vera leaf extract.
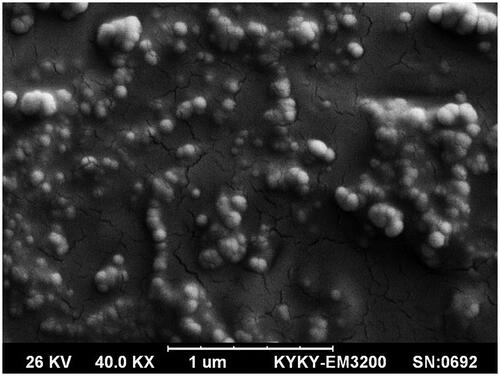
Figure 2. Mean body weight of mice administered biogenic Zn NPs at doses of 1, 2, 3, 4 and 5 g/kg and ZnSO4 at the dose of 100 mg/kg for 14 consecutive days.
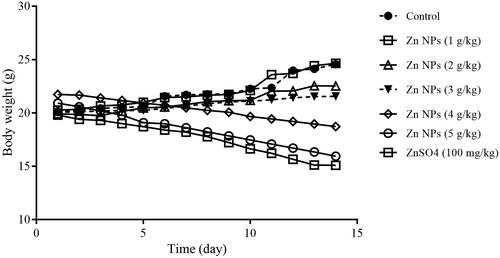
Table 1. Hematology parameters in whole blood.
Table 2. Clinical biochemistry parameters in serum.
Figure 3. Malondialdehyde (MDA) level in mice kidney, testis, brain, liver, heart, and spleen tissuesof the control group, and those treated with biogenic Zn NPs at the dose of 1.2, 2.4, and 6 mg/kg and ZnSO4 at the dose of 100 mg/kg. cp < .001 compared to the control.
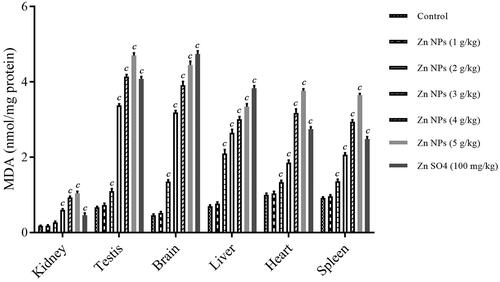
Figure 4. Glutathione (GSH) content in mice kidney, testis, brain, liver, heart, and spleen tissues ofthe control group, and those treated with biogenic Zn NPs at the dose of 1.2, 2.4, and 6 mg/kg and ZnSO4 at the dose of 100 mg/kg. bp < .01, and cp < .001 compared to the control.
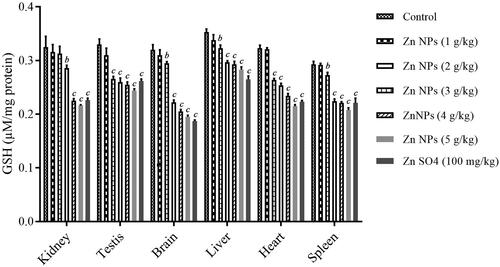
Figure 5. Super oxide dismutase (SOD) activity in mice kidney, testis, brain, liver, heart, and spleen tissues of the control group, and those treated with biogenic Zn NPs at the dose of 1.2, 2.4, and 6 mg/kg and ZnSO4 at the dose of 100 mg/kg. bp < .01, and cp < .001 compared to the control.
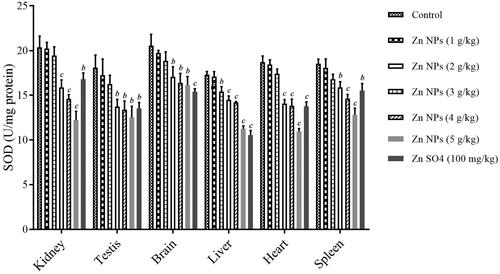
Figure 6. Catalase (CAT) activity in mice kidney, testis, brain, liver, heart, and spleen tissues of the control group, and those treated with biogenic Zn NPs at the dose of 1.2, 2.4, and 6 mg/kg and ZnSO4 at the dose of 100 mg/kg. ap < .05, bp < .01, and cp < .001 compared to the control.
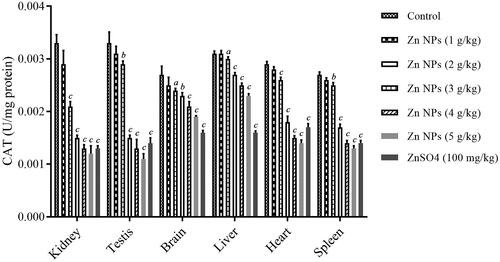
Figure 7. Effect of biogenic Zn NPs at the dose of 5 g/kg on the expression of cleaved-caspase-3 in mice kidney, testis, brain, liver, heart, and spleen tissues in comparison to their control.
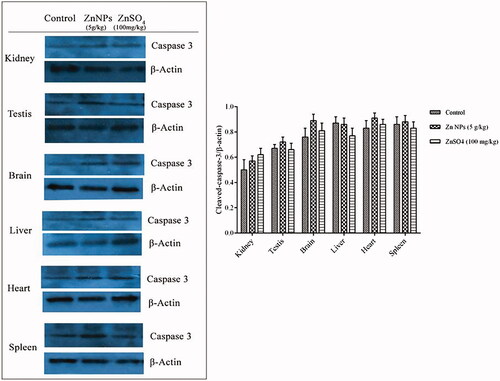
Figure 8. Content of Zn in mice kidney, testis, brain, liver, heart, and spleen tissues exposed to biogenic Zn NPs at the dose of 5 g/kg and ZnSO4 at the dose of 100 mg/kg. ap < .05, bp < .01, and cp < .001 compared to the control.
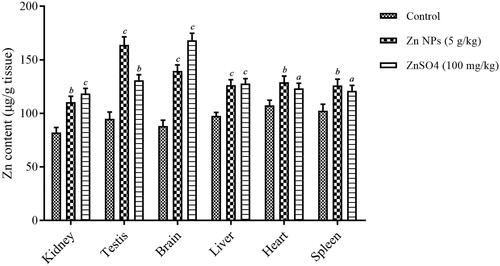
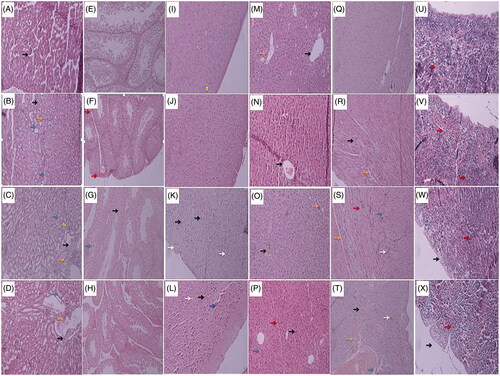
Figure 9. Histopathology of kidney, testis, brain, liver, heart, and spleen in mice treated with biogenic Zn NPs at two doses of 1 and 5 g/kg and ZnSO4 at the dose of 100 mg/kg for 14 consecutive days (H & E stain with × 100 magnifications). Control group: no pathologic changes were observed in normal glomeruli (black arrow) and tubules. (A), kidney of mouse treated with Zn NPs at dose of 1 g/kg group showed mild congestion (black arrow), mild focally mononuclear cell infiltration (orange arrow) and intratubular protein deposition (blue arrows) (B); kidney of mouse treated with Zn NPs at dose of 5 g/kg group showed congestion and dilatation of vessels (black arrow), congestion of glomeruli (green arrow), mononuclear cell infiltration (orange arrows) and intratubular protein deposition (bluish arrows) (C), kidney of mouse treated with ZnSO4 at the dose of 100 mg/kg group showed congestion and dilatation of vessels (black arrow), focally mild mononuclear cell infiltration (orange arrows) and intratubular protein deposition (blue arrows) (D). Control group: normal appearance (closely packed seminiferous tubules) (E), testis of mouse treated with Zn NPs at dose of 1 g/kg group showed closely packed seminiferous tubules, mild congestion and dilatation (red arrows) (F); testis of mouse treated with Zn NPs at dose of 5 g/kg group showed necrotic mature and immature spermatocytes (black arrow) and many abnormal-appearing residual bodies (blue arrows) (they are larger than normal residual bodies and often occur in tubular stages not normally associated with residual body formation) (G), testis of mouse treated with ZnSO4 at the dose of 100 mg/kg group showed mild to moderate tubular injury, sloughing and disorganization with interstitial edema (increased spaces between the tubules) (H). Control group: normal histopathology in brain cortex tissue (I), Brain cortex of mouse treated with Zn NPs at dose of 1 g/kg group was changed the same as control (J); the cerebral cortex at dose of 5 g/kg of Zn NRs showed mild edema (spongiosis), vascular congestion, neuronal vacuolization, some cellular injuries as red degeneration with pyknotic nuclei and eosinophilic cytoplasm and also the proliferation of reactive astrocytes (gliosis) (K), brain cortex of mouse treated with ZnSO4 at the dose of 100 mg/kg group showed moderate edema (spongiosis), the proliferation of reactive astrocytes (gliosis), marked cellular injuries as red degeneration with pyknotic nuclei and eosinophilic cytoplasm, vascular congestion and extravasation of RBC (L). Control group: no histopathologic changes with normal architecture, central vein (black arrows) and portal tract (orange arrow) (M), liver of mouse treated with Zn NPs at dose of 1 g/kg group showed central vein congestion (blackish arrow), and focally mild lobular inflammation (bluish arrow) (N); liver of mouse treated with Zn NPs at dose of 5 g/kg group showed central vein congestion (black arrow), and focal lobular inflammation (orange arrows) (O); liver of mouse treated with ZnSO4 at the dose of 100 mg/kg group showed sinusoidal congestion, cholestasis (red arrows) and kupffer cell proliferation (orange arrows) with increased binucleated hepatocytes (blackish arrow) (P). Control group: no pathological changes (Q), heart of mouse treated with Zn NPs at dose of 1 g/kg group showed mild congestion (black arrow) and mild edema (orange arrow)(R); heart of mouse treated with Zn NPs at dose of 5 g/kg group showed edema (orange arrow), some vacuolization of myocytes (blue arrows), mononuclear cells infiltration (whitish arrow), myocardial damage as presence of hypereosinophilic cardiomyocytes (reddish arrow) (S), heart of mouse treated with ZnSO4 at the dose of 100 mg/kg group showed some vacuolization of myocytes, congestion (black arrow), edema (orange), mononuclear cell infiltration (whitish arrow) and hemorrhage (green arrow) (T). Control group: no pathological changes with some megakaryocytes (red arrows) (U), spleen of mouse treated with Zn NPs at dose of 1 g/kg group showed congestion of red pulp and mild increase of megakaryocytes (red arrows) (V); spleen of mouse treated with Zn NPs at dose of 5 g/kg group showed mild thickening of the capsule, trabecula (black arrow), congestion of red pulp, dense basophilia of the cortex (cluster of lymphocytes other than white pulp) and mild increased megakaryocytes (red arrows) (W), spleen of mouse treated with ZnSO4 at the dose of 100 mg/kg group showed thickening of the capsule and trabecula (black arrow), with dense basophilia of the cortex (cluster of lymphocyte other than white pulp) and mild increased megakaryocytes (red arrows) less than Zn NPs at the dose of 5 g/kg group (X).