
Figures & data
Figure 1. The expression of BC050642 in osteosarcoma tissues and cell lines detected using qRT-PCR method. (A) The expression of BC050642 was higher in osteosarcoma tissues than in adjacent tissues and healthy W tissues. Asterisk (*) compared to healthy tissues, p < .05. (B) The expression of BC050642 was increased in osteosarcoma cell lines U2OS compared to normal osteoblastic cell line hFOB1.19. Asterisk (*) compared to hFOB1.19 cells, p < .05.
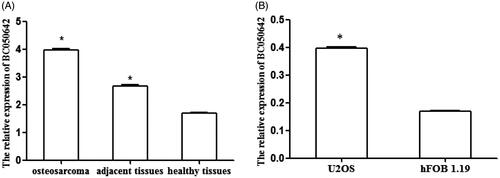
Figure 2. The expression of c-myc in osteosarcoma tissues and cell lines detected by the method of ELISA. (A) The levels of c-myc in osteosarcoma tissues, adjacent tissues and healthy tissues. Asterisk (*) compared to healthy tissues, p < .05. (B) Osteosarcoma cell lines U2OS and normal osteoblastic cell line hFOB1.19 were collected. The expression of c-myc was analyzed by RT-qPCR. Asterisk (*) compared tohFOB1.19 cells, p < .05.
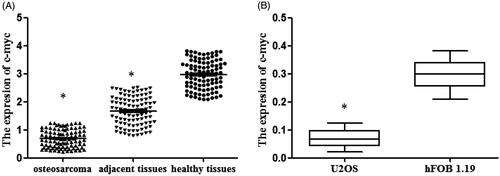
Figure 3. The effects of BC050642 on biological behaviors of osteosarcoma cell line U2OS. (A) The down-regulation of BC050642 inhibited cell proliferation; (B, C) the down-regulation of BC050642 reduced colony formation of osteosarcoma cells, asterisk (*) compared to Si-NC, p < .05; (D, E) the down-regulation of BC050642 induced cell apoptosis, asterisk (*) compared to Si-NC, p < .05.
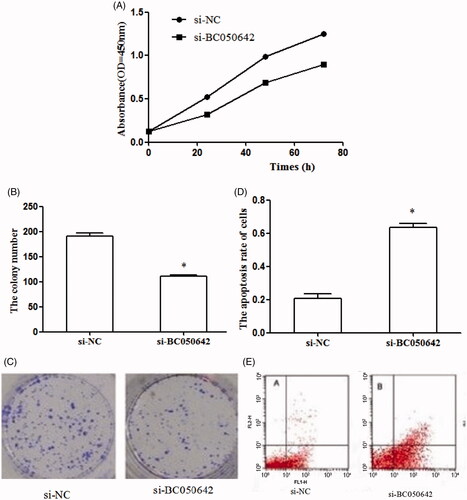
Figure 4. C-myc expression was significantly higher in cells transfected with pcDNA3.1-c-myc than those transfected with empty vector (pcDNA3.1) (*p < .05 represented the significant difference between the compared two).
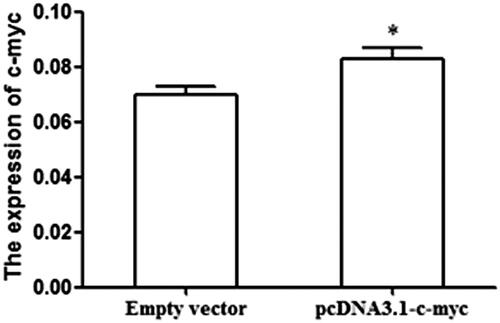
Figure 5. The effects of c-myc on biological behaviors of osteosarcoma cell line U2OS. (A) The up-regulation of BC050642 suppressed cell proliferation; (B, C) representative colony formation assay images of U2OS cells transfected by pcDNA3.1-vector and pcDNA3.1-c-myc. The numbers of the colonies in vector-transfected controls reached 100%, asterisk (*) compared to pcDNA3.1-vector, p < .05; (D, E) C-myc over-expression promoted cell apoptosis, asterisk (*) compared to pcDNA3.1-vector, p < .05.
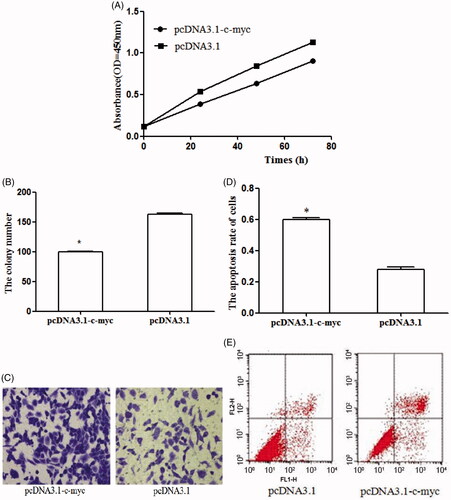
Table 1. The relationship between clinicopathologic characteristics and BC050642 in patients with osteosarcoma.
Figure 6. Kaplan–Meier analysis for osteosarcoma patients according to their expression of BC050642. Patients with high BC050642 expression had shorter overall survival than those with low BC050642 expression (log-rank test, p<.001).
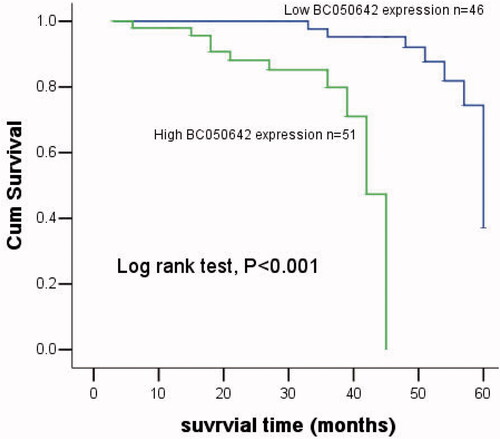
Table 2. Multivariate analysis adjusting clinical factors for prognostic value of BC050642 in patients with osteosarcoma.