Figures & data
Figure 1. Network topology for different soft-thresholding powers. Numbers in the plots indicate the corresponding soft thresholding powers. The approximate scale-free topology can be attained at the soft-thresholding power of 10.
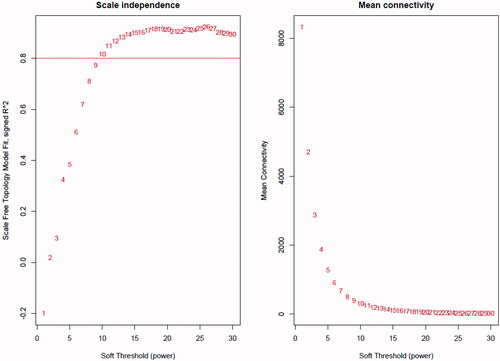
Figure 2. Gene modules identified by WGCNA. Gene dendrogram was obtained by clustering the dissimilarity with the colors of the corresponding modules represented by the color lines based on consensus topological overlap. Each colored line represents a color-coded module containing a set of highly connected genes. Twenty-two modules were identified.
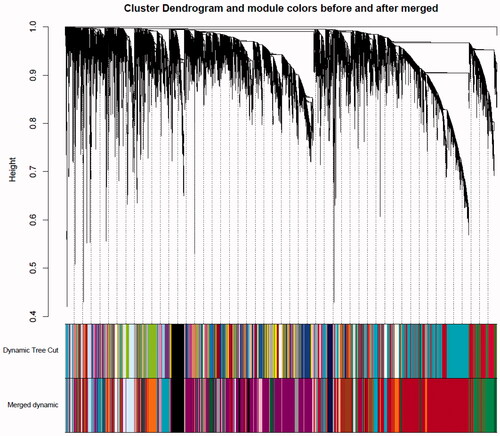
Figure 3. Relationships of consensus module Eigen genes and different cancer types. Each row in the heat map corresponds to a consistency module and each column to a type of cancer. The module name is displayed to the left of each cell. The numbers in the cell showed the correlation between the corresponding module's eigengenes and the type of cancer, and the p-values are shown in parentheses below the correlation. Intensity and direction of correlations are indicated on the right side of the heatmap.
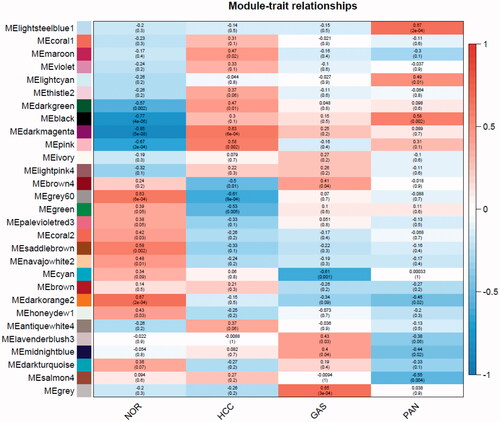
Figure 4. Heatmap of enriched terms across input gene lists, colored by p values.
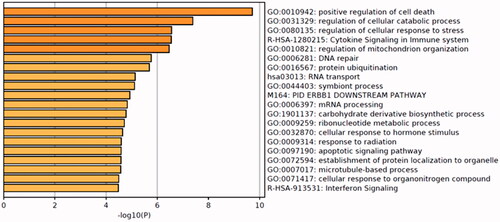
Figure 5. Network of enriched terms: colored by p values, where terms containing more genes tend to have a more significant p values.
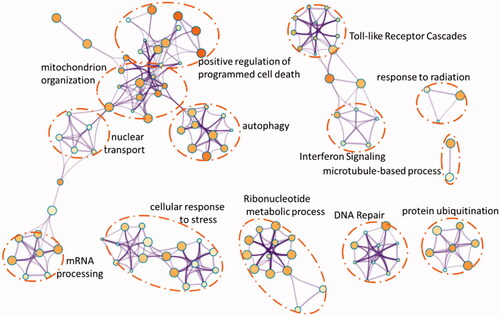
Figure 6. Protein-protein interction network for DEGs and the distribution of hub genes from Cytohubba.
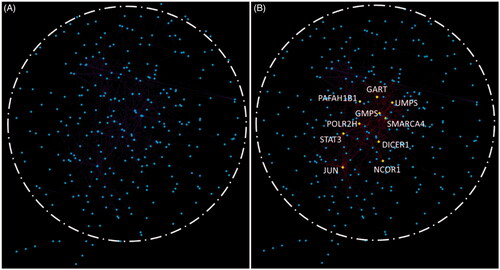
Figure 7. Protein-protein interaction network and MCODE components identified.
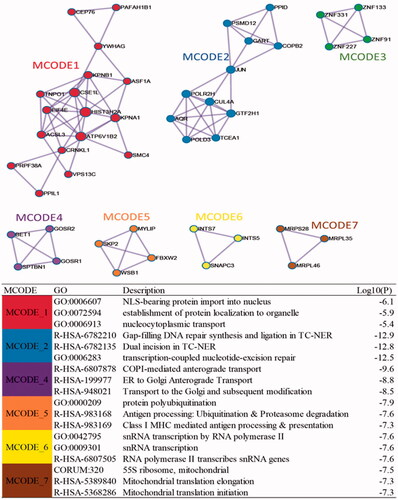
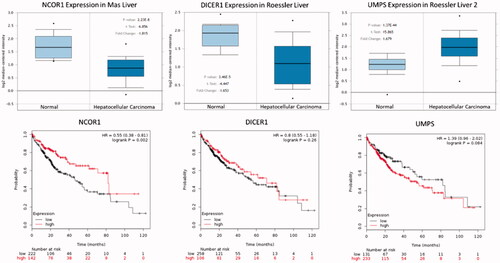
Figure 8. The box plot of expression value of NCOR1, DICER1 and UMPS in hepatocellular carcinoma. X-axis represents normal (left) and cancer group (right), Y-axis represents mRNA expression in log2 median/mean centered intensity. The figures below show the relationship between gene expression and survival time of patients.