Figures & data
Figure 1. LPS triggered liver cell apoptosis and inflammatory injury. (A) Chemical skeleton structure of Emodin. Followed by 5 μg/ml LPS stimulation for 12 h, (B and C) viability and apoptosis of L-02 cells and primary hepatocytes (HP) were measured respectively, (D) the apoptosis-associated protein levels were tested, (E–G) the pro-inflammatory cytokines in culture supernatant and in cells were measured. **p < .01; ***p < .001.
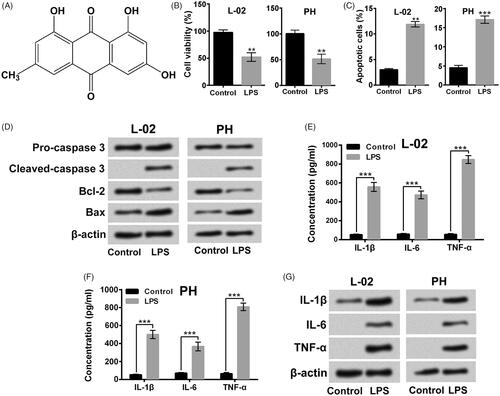
Figure 2. Emodin weakened LPS-triggered liver cell viability loss and apoptosis. (A) Viability of L-02 cells and primary hepatocytes (PH) after 0, 5, 10, 15 or 20 μM Emodin exposure were measured. Followed by 5 μg/ml LPS and/or 15 μM Emodin exposure, (B and C) viability and apoptosis were detected respectively, (D) the apoptosis-associated protein levels were evaluated. *p < .05; **p < .01; ***p < .001.
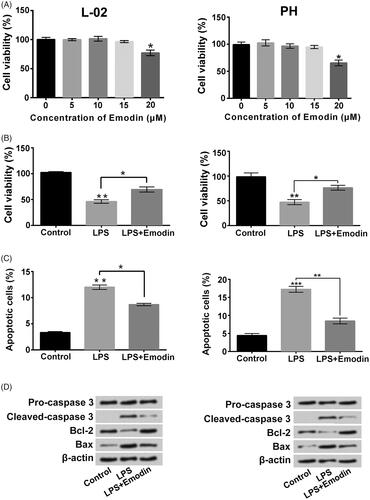
Figure 3. Emodin weakened the LPS-triggered liver cell inflammatory factor expression. Followed by 5 μg/ml LPS and/or 15 μM Emodin exposure, (A and B) the pro-inflammatory cytokinesin culture supernatant and in cells were analyzed. *p < .05; **p < .01; ***p < .001.
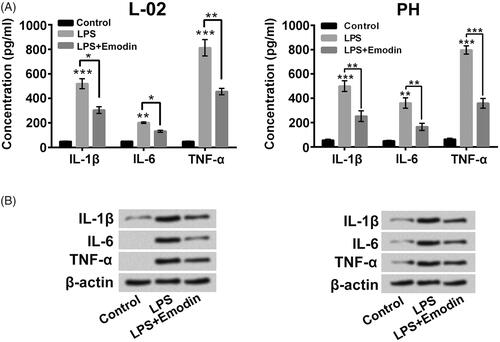
Figure 4. Emodin suppressed NF-κB signalling pathway triggered by LPS in liver cells. The t-p65, p-p65, t-IκBα and p-IκBα expressions in L-02 cells and primary hepatocytes (PH) after 5 μg/ml LPS and/or 15 μM Emodin exposure were measured. *p < .05; ** p < .01; ***p < .001.
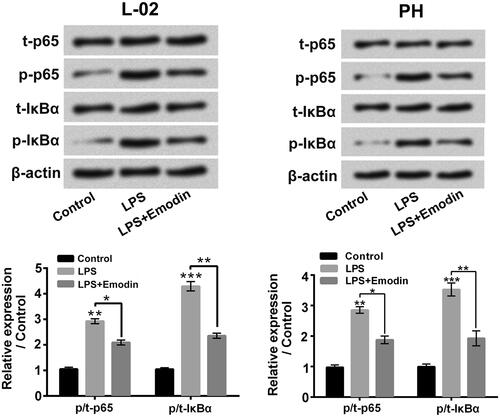
Figure 5. Emodin attenuated the miR-145 expression reduction caused by LPS in liver cells. The miR-145 levels in L-02 cells and primary hepatocytes (PH) after 15 μM Emodin treatment were detected. *p < .05.
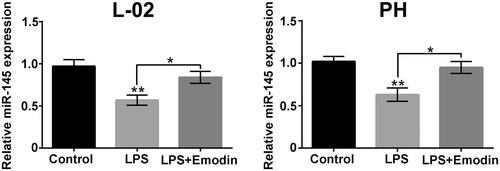
Figure 6. miR-145 joined in the modulated of inflammatory factor expression in liver cells. (A) The miR-145 expressions in L-02 cells and primary hepatocytes (PH) after miR-145 mimic or miR-145 inhibitor transfection were measured. Followed by LPS treatment and/or miR-145 mimic (miR-145 inhibitor) transfection, (B and C) the pro-inflammatory cytokines in culture supernatant and cells were analyzed. *p < .05; **p < .01; ***p < .001.
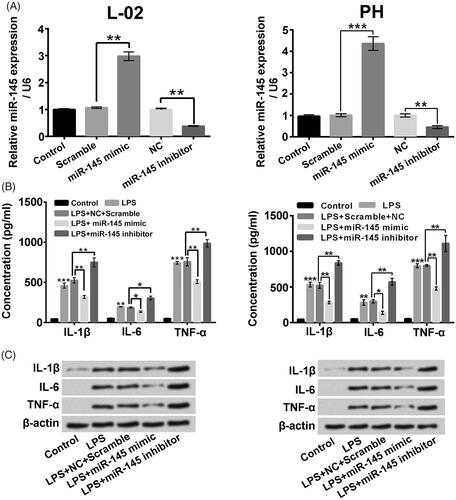
Figure 7. miR-145 negatively modulated IRAK1 in liver cells. The IRAK1 expressions in L-02 cells and primary hepatocytes (PH) with miR-145 mimic or miR-145 inhibitor transfection were determined. *p < .05; **p < .01.
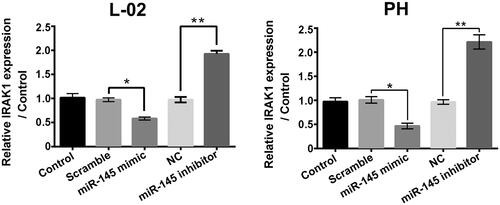
Figure 8. IRAK1 exerted modulatory activity on NF-κB signalling pathway in liver cells. (A and B) The IRAK1 mRNA and protein expressions in L-02 cells and primary hepatocytes (PH) followed by pc-IRAK1 or sh-IRAK1 transfection were measured. (C) The t-p65, p-p65, t-IκBα and p-IκBα levels in L-02 cells and primary hepatocytes after pc-IRAK1 or sh-IRAK1 transfection were determined. *p < .05; **p < .01.
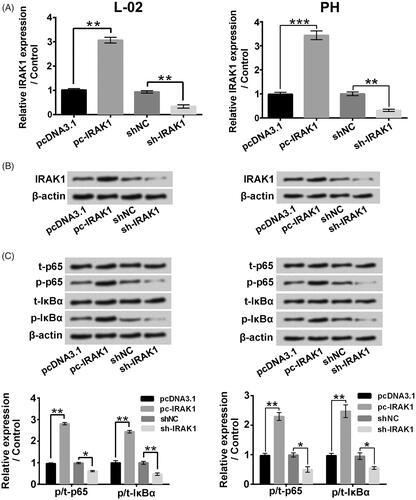
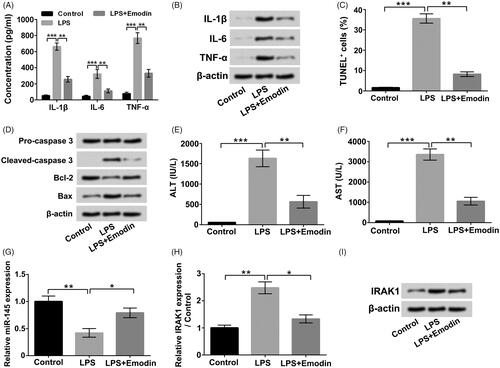
Figure 9. Emodin alleviated LPS-triggered acute liver damage in vivo. (A and B) The pro-inflammatory cytokines in serum and liver tissues were assessed. (C) The cell apoptosis in liver tissues was assessed. (D) The apoptosis-associated protein levels in liver tissues were assessed. (E and F) The AST and ALT concentrations in serum were detected. (G) The miR-145 expressions in liver tissues were measured. (H and I) The IRAK1 mRNA and protein levels in liver tissues were detected. *p < .05; **p < .01; ***p < .001.