Figures & data
Figure 1. H2O2 inhibits Srxn1 protein expression in astrocytes. Note: compared with group NC, *P < .05; compared with group H2O2+si-con, #P < .05.
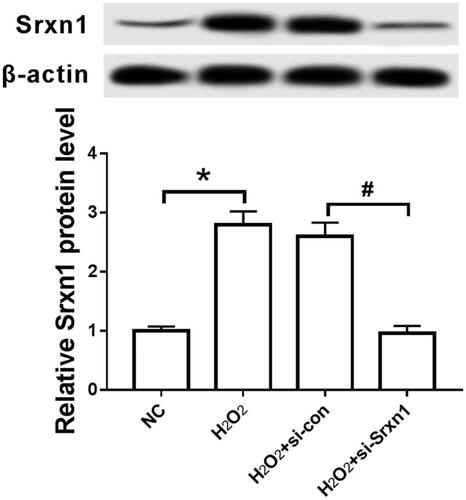
Figure 2. Effects of knockdown of Srxn1 on LDH, SOD and MDA in astrocytes induced by H2O2. Note: (A) LDH release level of cells in each group; (B) SOD activity in each group; (C) MDA content in each group. Compared with NC group, *P < .05; compared with H2O2+si-con group, #P < .05.
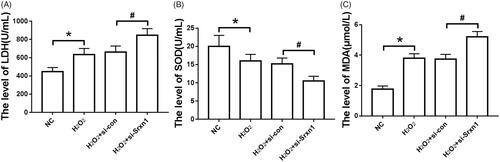
Figure 3. Knockdown of Srxn1 promotes H2O2-induced apoptosis in astrocytes. Note: (A) detection of cell apoptosis by flow cytometry; (B) apoptosis rate of each group. Compared with NC group, *P < .05; compared with H2O2+si-con group, #P < .05.
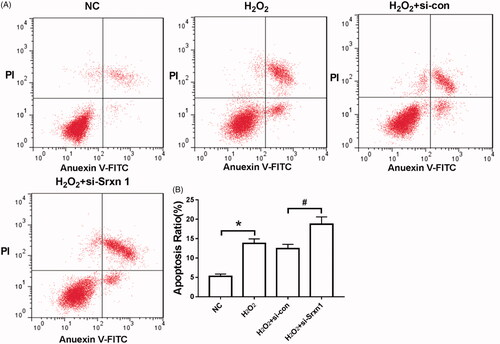
Figure 4. Knockdown of Srxn1 inhibits H2O2 induced Notch pathway in astrocytes. Note: (A) the electrophoresis of Notch 1, NICD and Hes1 protein in each group; (B) the expression level of Notch 1 protein in each group; (C) the expression level of NICD protein in each group; (D) the expression level of Hes1 protein in each group. Compared with NC group, *P <.05; compared with H2O2+si-con group, #P < .05.
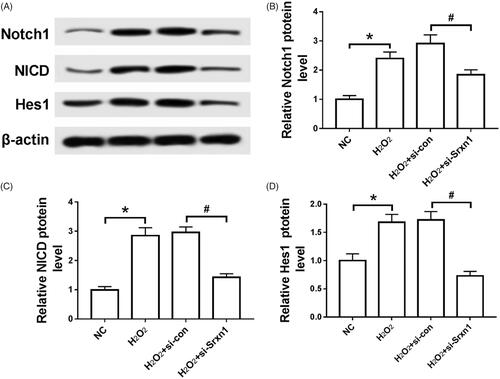
Figure 5. Inhibition of Notch singling pathway on oxidative damage and apoptosis of astrocytes induced by H2O2. Note: (A) the release amount of LDH in each group; (B) the detection of SOD activity in each group; (C) the change of MDA content in each group; (D) the apoptosis rate of each group. *P < .05 compared with NC group; #P < .05 compared with H2O2+PBS group.
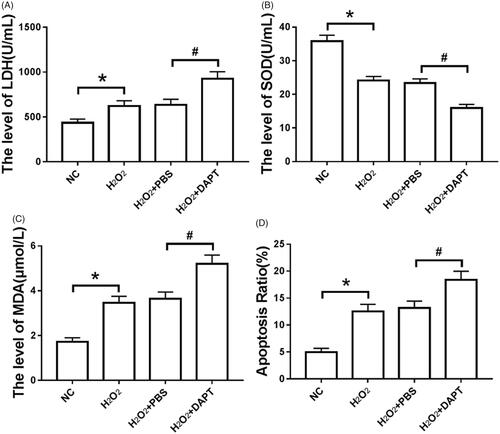
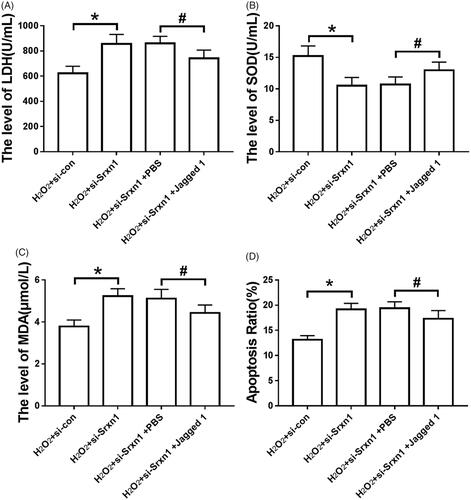
Figure 6. Jagged 1 can attenuate the effect of knockdown Srxn1 on H2O2 induced oxidative damage and apoptosis in astrocytes. Note: (A) LDH release in astrocytes induced by hydrogen peroxide after Jagged 1 pretreatment and knockdown of Srxn1; (B) SOD activity in astrocytes induced by hydrogen peroxide after Jagged 1 pretreatment and knockdown of Srxn1; (C) MDA content in astrocytes induced by hydrogen peroxide after Jagged 1 pretreatment and knockdown of Srxn1; (D) hydrogen peroxide after Jagged 1 pretreatment and knockdown of Srxn1. 2 apoptosis rate induced by astrocytes. Compared with H2O2+si-con group, *P < .05; compared with H2O2+si-Srxn1 + PBS group, *P < .05.