Figures & data
Figure 1. UV-vis spectrum of CR-AuNPs at 540 nm for the period of 24 and 48 h and 5, 15 and 30th day.
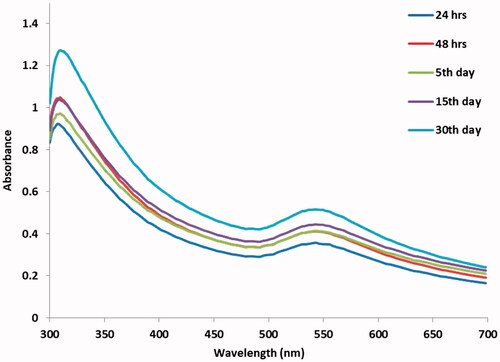
Figure 2. (A) DLS of AuNPs synthesized from CR-AuNPs, (B) EDX analysis of photosynthesized AuNPs.
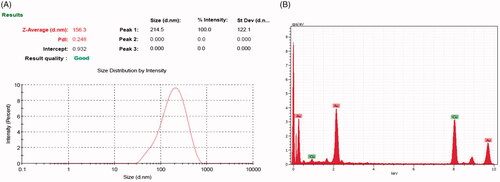
Figure 3. Photomicrographs of HR-TEM analysis at (A) 50 nm, (B) 200 nm. (C) SAED pattern of AuNPs synthesized from CR-AuNP.
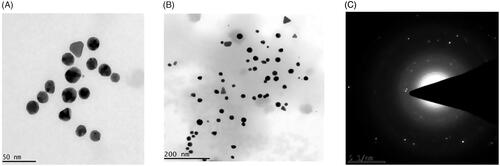
Figure 4. FTIR analysis and SAED pattern of AuNPs synthesised from CR-AuNPs.
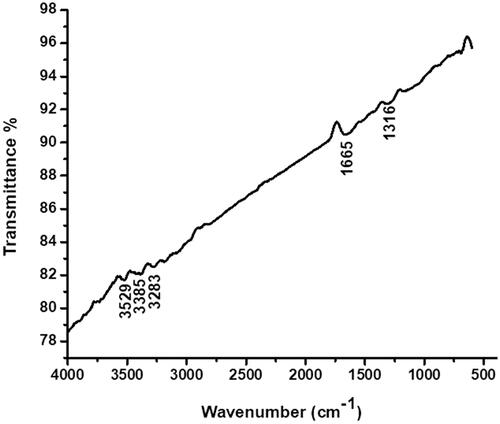
Figure 5. AFM analysis of AuNPs synthesized from CR-AuNPs.
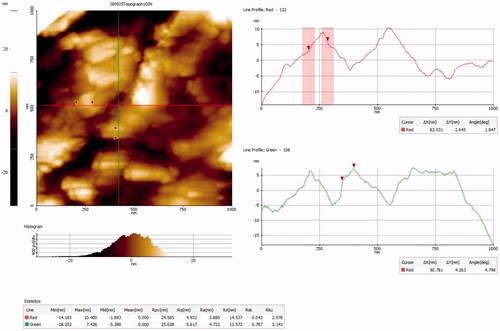
Figure 6. (A) Effect of CR-AuNPs on morphological characteristics and cell viability of HeLa cell lines at 24 h using MTT assay. Doxorubicin (Dox) is used as positive control. (B) cell viability of 3T3cell lines at 24 h using MTT assay. (C) CR-AuNPs induces ROS production in HeLa cells using DCFH-DA staining assay. HeLa cells were treated with CR-AuNPs at various concentrations (5 and 10 µg/ml) for 24 h. ROS measurement was carried out using spectrofluorimetry. Results in a different dose enhance in ROS production as shown through increased % DCF staining ratio. Values were accessible as mean + SD of three experiments in every group ANOVA followed by DMRT. Asterisks indicate statically different from control: *p < .05.
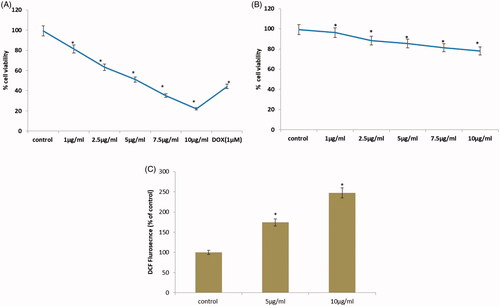
Figure 7. Effect of CR-AuNPs induces apoptotic incidence. HeLa cells treated with control and CR-AuNPs at different concentrations (5 and 10 µg/ml) at 24 h, stained with AO/EtBr dye (40×). White arrow show green fluorescence; Orange arrow show apoptotic bodies; Blue arrow show apoptotic cells; Yellow arrow show necrotic cells.
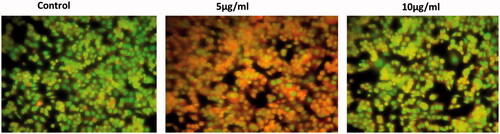
Figure 8. Caspase-3 and -9 activity in HeLa cells following treatment with CR-AuNPs at 5 and 10 µg/ml for 24 h. Data represent the mean values ± SD from six independent experiments. *p < .05 compared to the control.
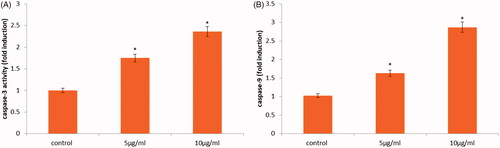
Figure 9. CR-AuNPs induce apoptosis pathway on HeLa cells. (A) Protein expression of Bcl-2, Bax & Bid. (B–D) The representative graph shows the relative protein expression of fold changes in immunoblots. Values are expressed as mean ± SD for three experiments. *p < .05 compared to the control.
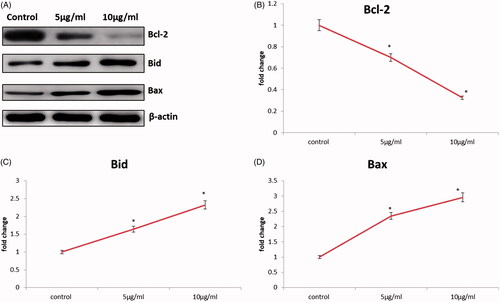
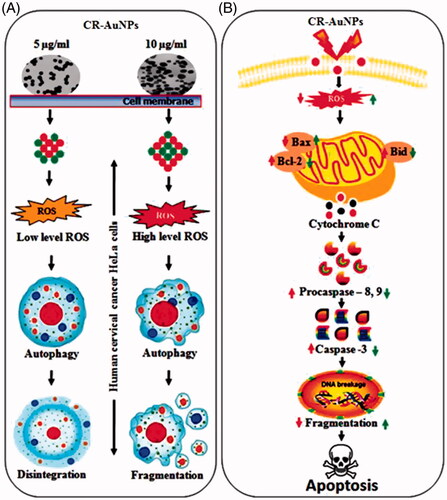
Figure 10. (A) Schematic representation of cellular modulation induced by CR-AuNPs in human cervical cancer (HeLa) cells. CR-AuNPs (5 and 10 µg/ml) induced in HeLa cells through ROS level in low and high increased in dose-dependent manner. Depending on ROS level generated by CR-AuNPs autophagy induction might be related with megakaryocytic disintegration and/or fragmentation in HeLa cells. Although high doses of CR-AnUPs (10 µg/ml) induced autophagy apoptosis, low dose (5 µg/ml) did not lead to any proliferation inhibitory or cytotoxic effects in HeLa cells. (B) The fundamental signalling pathway of CR-AuNPs induced apoptosis in cervical cancer HeLa cells.