Figures & data
Figure 1. Preparation of 3 D PDMS porous structure. The sugar templates were made of three sugar materials: cotton candy sheet, hard candy and granulated sugar. The sugar units were assembled into required mould and pressed. Add PDMS to the sugar template and evacuated for 40 min allowing the sugar fulfilled with PDMS. The PDMS bricks with sugar was cured, then put them into an ultrasonic cleaner to remove sugar with water. Cover the 3 D PDMS porous structure with PDMS sheets to create two chambers connected by a central channel. Put the PDMS porous structure with chambers on a cyclic rotating device. By means of gravity, red blood cells flow into the lower chamber via the central channel. The gas is pressed and going to upper chamber. Red arrows show the flow direction of RBCs and yellow arrows of the air.
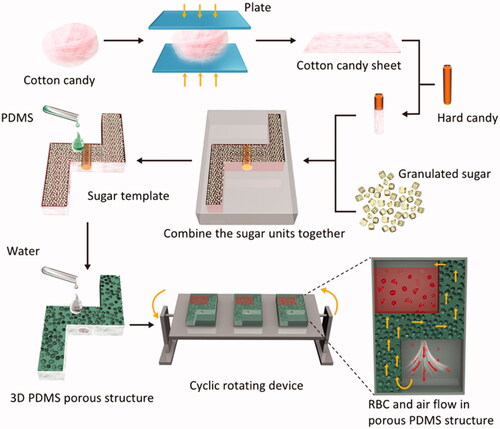
Figure 2. SEM image of porous PDMS made from cotton candy sheet (A) and granulated sugar (B).
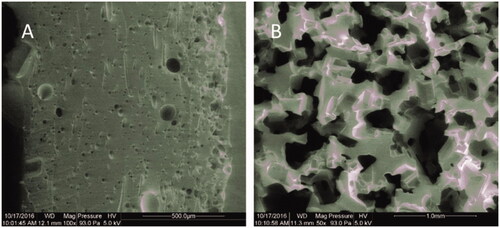
Figure 3. Acid-base indices pH (A), cBase (B) and HCO3− (C). aap < .01 versus baseline. bbp < .01 versus static 12 h. ccp < .01 versus static 24 h. ddp < .01 versus rotated 12 h. eep < .01 versus rotated 24 h. *p < .05 versus static at the same time. **p < .01 versus static at the same time.
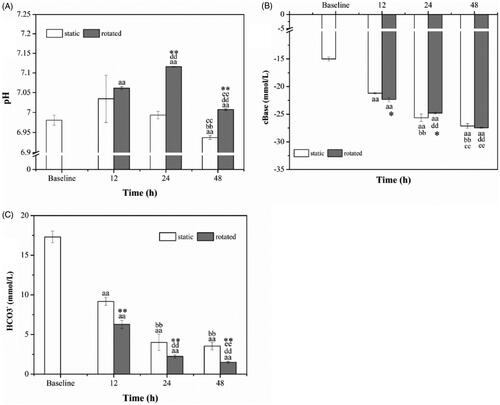
Figure 4. Partial pressure of oxygen (A) and carbon dioxide (B). aap < .01 versus baseline. bbp < .01 versus static (12 h). ddp < .01 versus rotated (12 h). ep < .05 versus rotated (24 h). **p < .01 versus static at the same time.
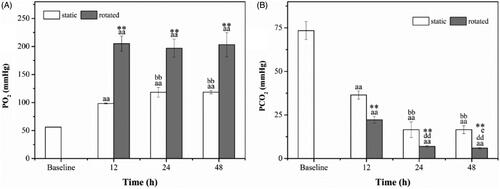
Figure 5. Ions and Glucose. K+ (A), Na+ (B), Cl− (C) and Glucose (D). ap < .05 versus baseline. aap < .01 versus baseline. bp < .05 versus static (12 h). bbp < .01 versus static (12 h). ccp < .01 versus static (24 h). ddp < .01 versus rotated (12 h). eep < .01 versus rotated (24 h). *p < .05 versus static at the same time. **p < .01 versus static at the same time.
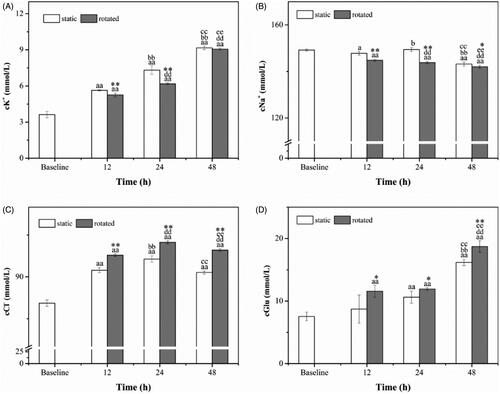
Figure 6. Red blood cell indices. RDW (A), MCV (B), MCH (C) and MCHC (D). ap < .05 versus baseline. aap < .01 versus baseline. dp < .01 versus rotated (12 h). *p < .05 versus static at the same time. **p < .01 versus static at the same time.
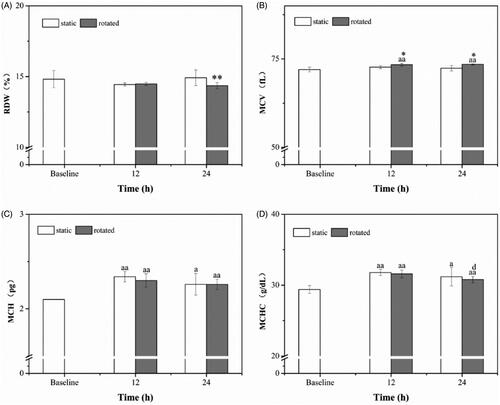
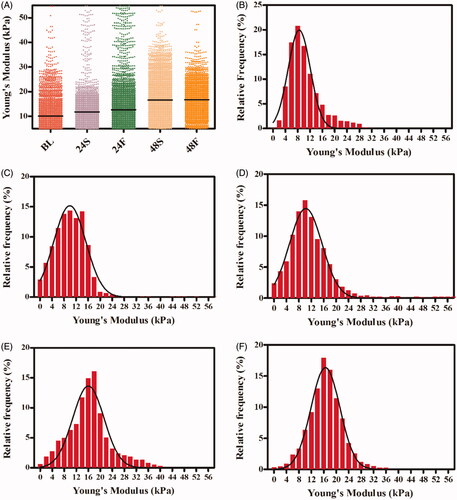
Figure 7. Young’s Modulus from RBCs. Comparison of Young's Modulus from RBCs with/without rotation at different time. Each point represents a Young's Modulus from RBCs (A). Histogram representations of relative frequency and their Gaussian distributions for Young's Modulus for samples of baseline (B). Histogram representations of relative frequency and their Gaussian distributions for Young's Modulus for 24 h in static (C) or in rotated (D). Histogram representations of relative frequency and their Gaussian distributions for Young's Modulus for 48 h in static (E) or in rotated (F).