
Figures & data
Figure 1. Detection of miRNA in a nanochannel.
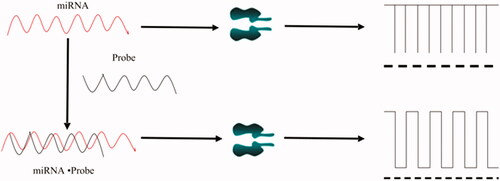
Figure 2. Nanochannels detection of various nucleic acid samples and corresponding scatter diagrams.
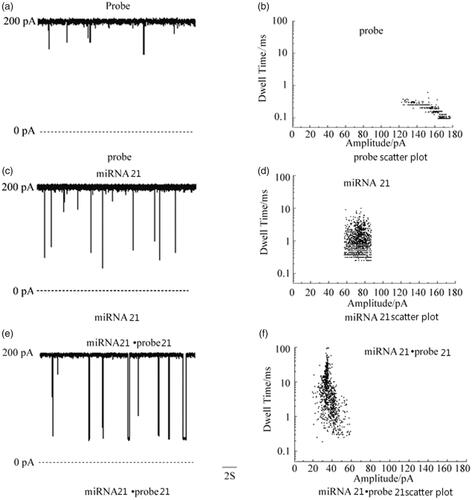
Figure 3. Mean residence time values of various nucleic acid samples. Amplitude is the magnitude of the pulse current. It can be seen that the pulse currents of different nucleic acids pass through the nanochannels are different, and the blocking time is different. The pulse current and blocking time of probe, miRNA 31 and miRNA 31·probe 31 increase sequentially.
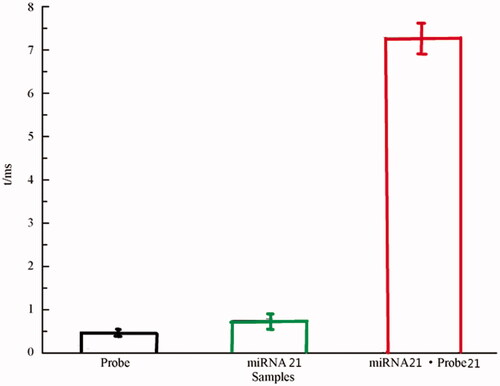
Figure 4. Nanochannels detection of miRNA 21 end match and front match and corresponding scatter diagrams.
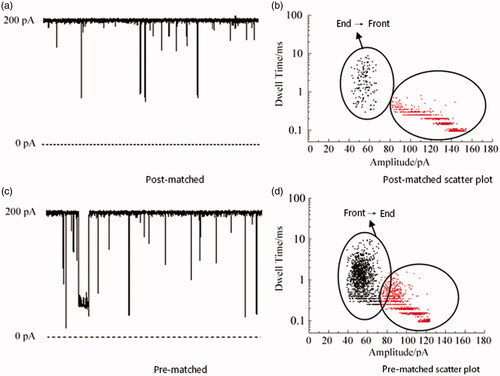
Figure 5. Residence time histogram of typical current for different miRNAs·probes.
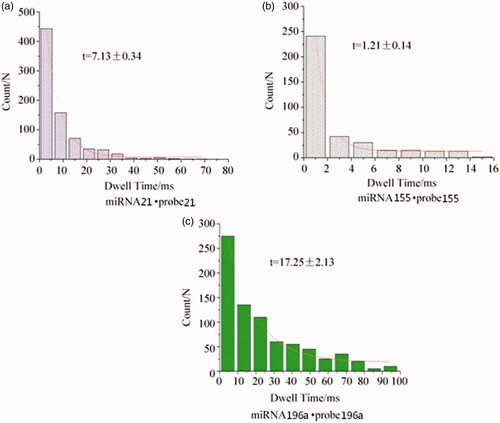
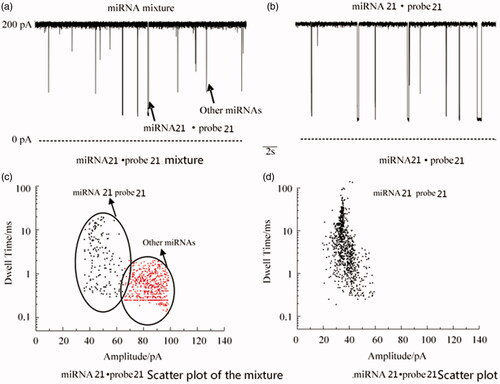
Figure 6. Nanochannels detection of miRNA 21.probe 21 in the presence of other miRNAs and the corresponding scatter diagrams.
Data availability
All data are available. Please contact us to access if it is needed.