
Figures & data
Table 1. Considered variables and responses along with their levels and constraints.
Figure 1. 1H NMR spectra of mPEG-PCL copolymer in CDCl3 (A). FT-IR spectrum of mPEG-PCL copolymer (B).
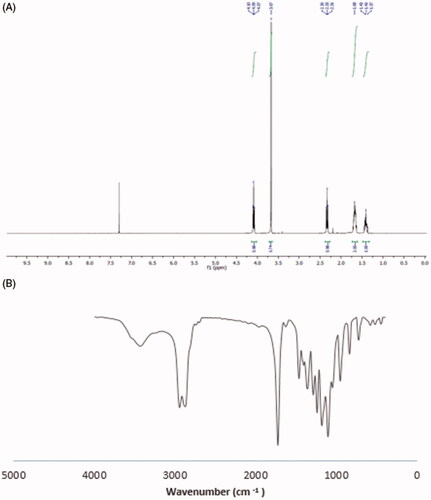
Table 2. Experimental design matrix, and analysis of variance for D-optimal design.
Figure 2. Interactive effect of surfactant concentration and amount of mPEG-PCL on the particle size and 3D surfaces (A,B); interactive effect of surfactant concentration and amount of mPEG-PCL on the entrapment efficiency and 3D surfaces (C,D).
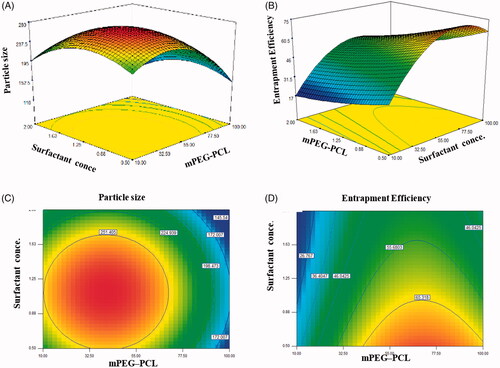
Figure 3. AFM image of IDV-mPEG-PCL NPs (A). SEM image of IDV-mPEG-PCL NPs (B). DSC spectra of IDV, mPEG-PCL, the physical mixture of free IDV and MPEG-PCL and IDV-mPEG-PCL NPs (C). XRD spectra of IDV, mPEG-PCL, the physical mixture of free IDVand MPEG-PCL and IDV-mPEG-PCL NPS (D).
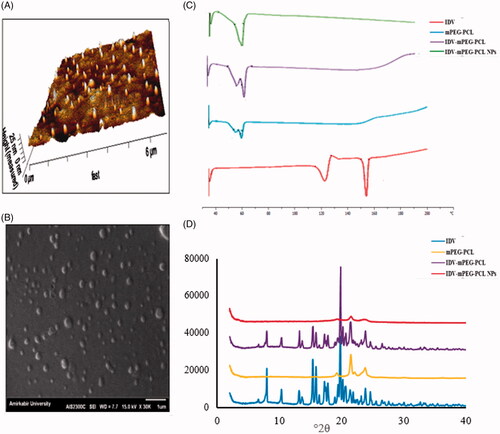
Figure 4. The release profiles of IDV-m-PEG-PCL NPS and free drug behavior through the dialysis membrane in PBS (pH 7.4, 37 °C) (A). Plasma concentration-time curves of IDV-mPEG-PCL NPs and IDV solution after oral administration (20 mg/kg of IDV in rat) (B). Effect of concentration on IDV transport from the apical to basolateral side of the Caco-2 cell monolayer. NPs concentrations and IDV (10, 100,and 200 μg/ml) (C). The Caco-2 cell uptake efficiency measurement after 3 h incubation with IDV-mPEG-PCL NPs and IDV at 37 °C. NPs concentrations and IDV (10, 100 and 200 μg/ml) (D). Data represent mean ± SD, n = 3.
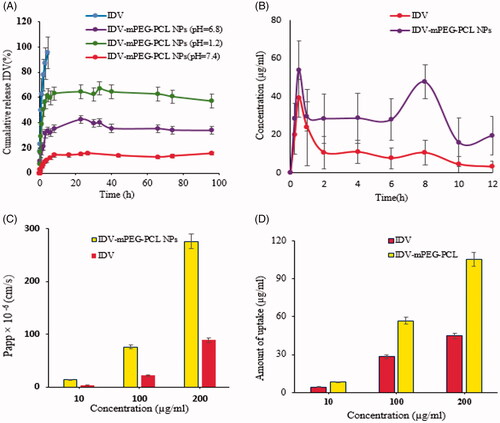
Table 3. Summary of model parameters of IDV release data.
Table 4. The plasma pharmacokinetic parameters of IDV after oral administration of IDV solution, and IDV-mPEG-PCL NPs at a dose of 20 mg/kg in the rat.