Figures & data
Figure 1. UV visible spectrum of synthesized AgNPs.
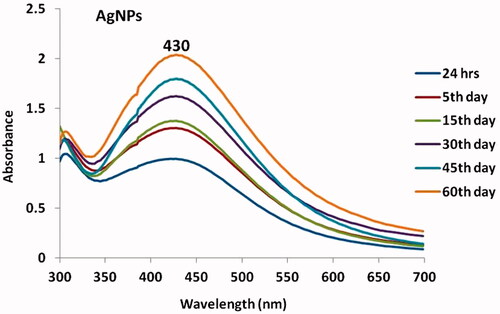
Figure 2. Size distribution analysis of synthesized AgNPs.
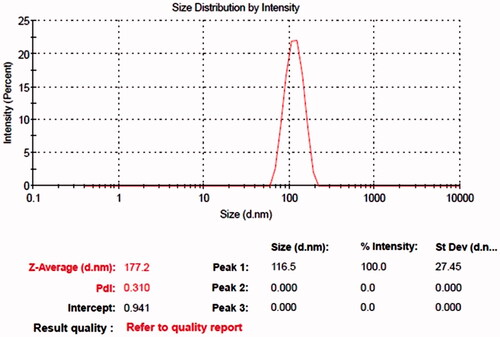
Figure 3. Transmission electron microscopic (TEM) and EDX analysis of synthesized AgNPs.
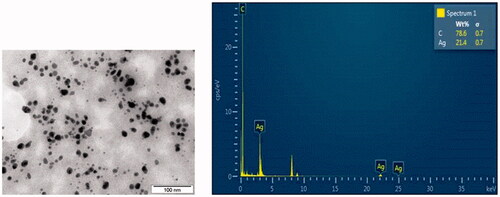
Figure 4. Fourier-transform infrared spectroscopy analysis of silver nanoparticles.
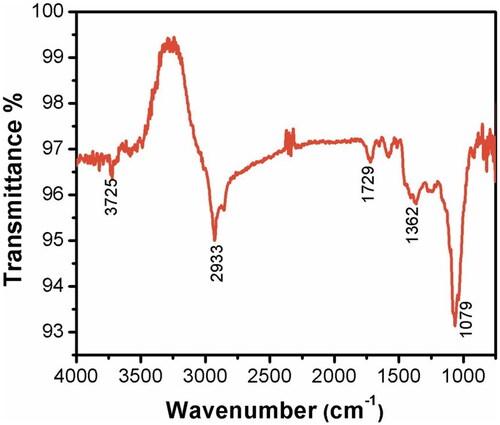
Figure 5. Atomic force microscopic analysis of synthesized AgNPs.
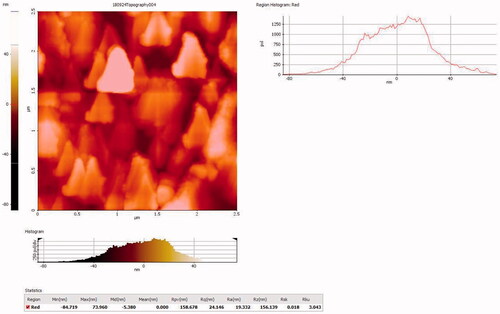
Figure 6. Antimicroial activity of synthesized AgNPs.
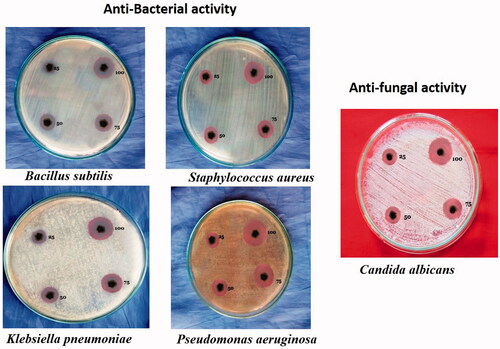
Figure 7. Effect of AgNps on BALF total protein levels in mice. Each bar represents mean ± SEM of 6 animals, #, *represents statistical significance between control vs other groups at p < .05, p < .01 level, respectively, using Dunnett’s test.
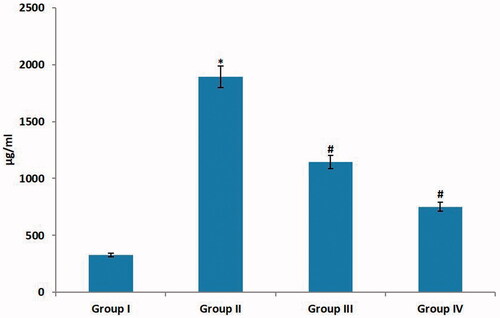
Figure 8. Effect of AgNPs on total number of cells in mice. Each bar represents mean ± SEM of 6 animals, *, **represents statistical significance between control vs other groups at p < .05, p < .01 level, respectively, using Dunnett’s test.
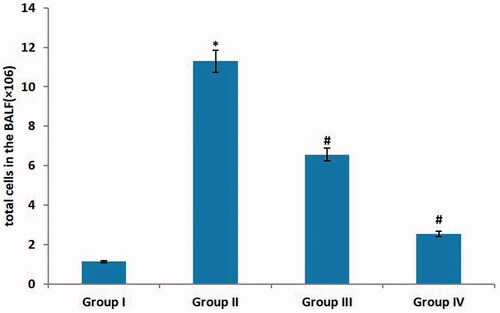
Figure 9. Effects of synthesized silver nanoparticles on BALF cytokines in mice. Each bar represents mean ± SEM of 6 animals, #, *represents statistical significance between control vs other groups at p < .05, p < .01 level, respectively, using Dunnett’s test.
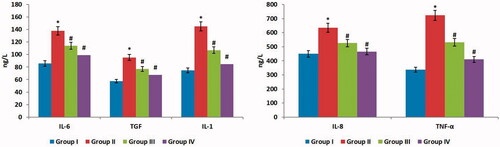
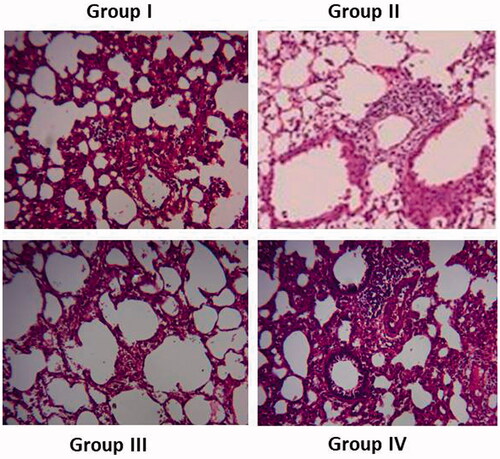
Figure 10. Effect of AgNPs on histopathological staining of lungs in mice.