Figures & data
Figure 1. Cobalt chloride (CoCl2) induced hypoxia injury. (A) Cell viability, (B) cell apoptosis, (C) cell apoptotic proteins p53, Bcl-2, Bax and cleaved-Caspase-3 were detected using cell counting kit-8 assay, flow cytometry and western blot, respectively. All data demonstrated as mean + standard deviation (SD) of three replicates. *p < .05, **p < .01 and ***p < .001 were all significant difference.
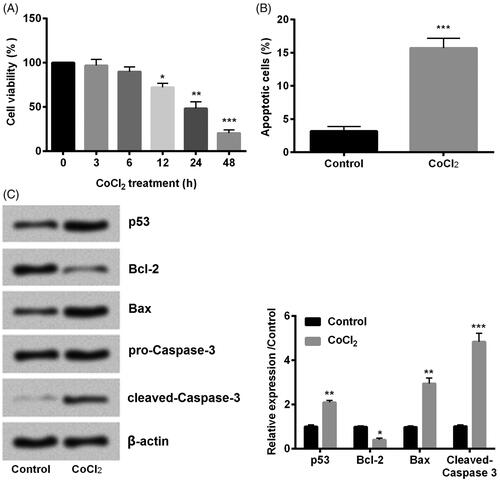
Figure 2. Cobalt chloride (CoCl2) induced expression of lncRNA regulator of reprogramming (ROR). The expression of ROR was detected using qRT-PCR. All data demonstrated as mean + standard deviation (SD) of three replicates. *p < .05 indicated significant difference.
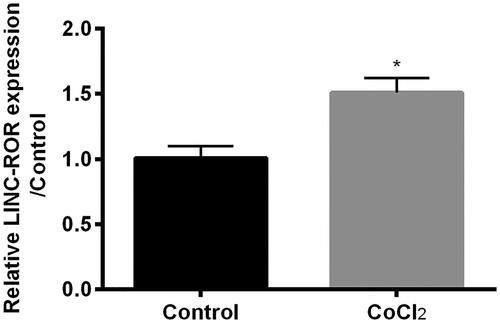
Figure 3. Overexpression of regulator of reprogramming (ROR) promoted cobalt chloride (CoCl2) treated HK-2 cell growth. (A) The alter expression of ROR was via transfection and expression of ROR was determined using qRT-PCR. (B) Cell viability, (C) cell apoptosis, (D,E) cell apoptosis-related proteins and (F) HIF-α expression were analyzed using cell counting kit-8 assay, flow cytometry and western blot, respectively. All data demonstrated as mean + standard deviation (SD) of three replicates. *p < .05, **p < .01 and ***p < .001 were all significant difference.
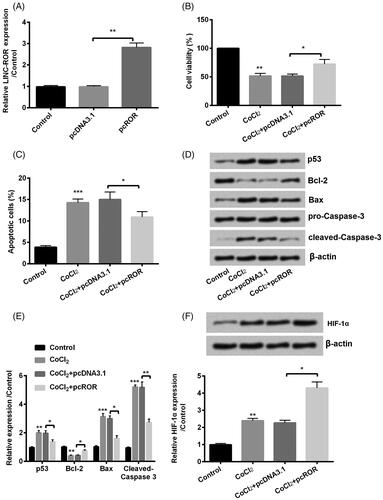
Figure 4. Silence of regulator of reprogramming (ROR) inhibited cobalt chloride (CoCl2) treated HK-2 cell growth. (A) The alter expression of ROR was via transfection and expression of ROR was determined using qRT-PCR. (B) Cell viability, (C) cell apoptosis, (D,E) cell apoptosis-related proteins and (F) hypoxia-inducible factor (HIF)-α expression were analyzed using cell counting kit-8 assay, flow cytometry and western blot, respectively. All data demonstrated as mean + standard deviation (SD) of three replicates. *p < .05, **p < .01 and ***p < .001 were all significant difference.
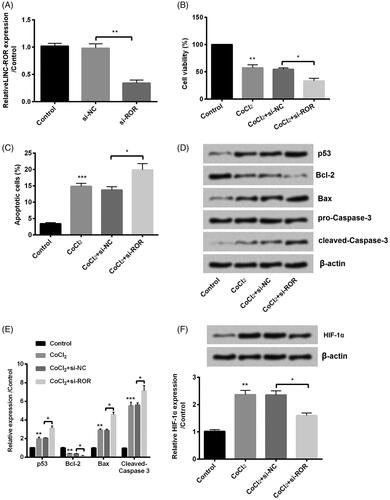
Figure 5. Regulator of reprogramming (ROR) decreased the expression of miR-145 in cobalt chloride (CoCl2) treated cells. The expression of miR-145 was detected using qRT-PCR. All data demonstrated as mean + standard deviation (SD) of three replicates. *p < .05 and **p < .01 were both significant difference.
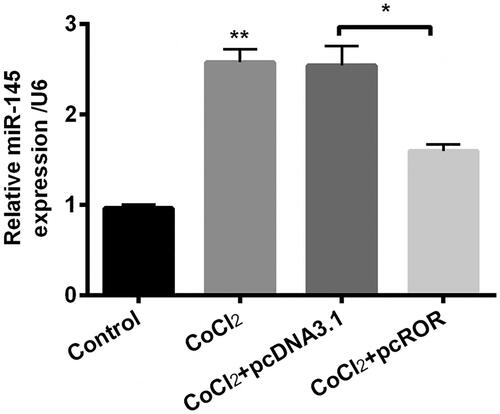
Figure 6. Overexpression of regulator of reprogramming (ROR) promoted cobalt chloride (CoCl2) treated HK-2 cell growth through downregulation of miR-145. (A) The alter expression of miR-145 was via transfection and expression of miR-145 was determined using qRT-PCR. (B) Cell viability, (C) cell apoptosis, (D,E) cell apoptosis-related proteins and (F) hypoxia-inducible factor (HIF)-α expression were analyzed using cell counting kit-8 assay, flow cytometry and western blot, respectively. All data demonstrated as mean + standard deviation (SD) of three replicates. *p < .05, **p < .01 and ***p < .001 were all significant difference.
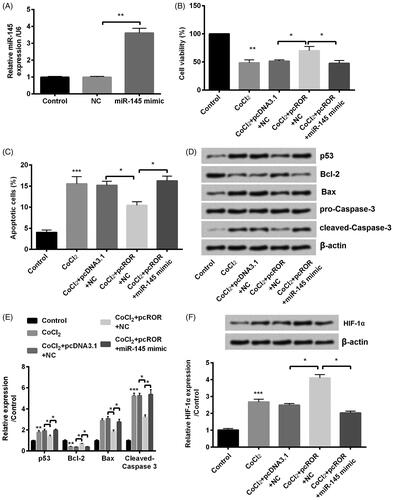
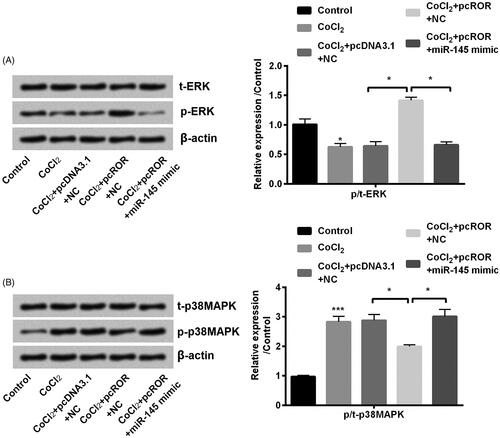
Figure 7. Regulator of reprogramming (ROR) activated ERK and inactivated MAPK pathway. (A) The phosphorylation of ERK and (B) MAPK was determined through western blot. All data demonstrated as mean + standard deviation (SD) of three replicates. *p < .05 and **p < .01 were both significant difference.