Figures & data
Figure 1. The analysis process of this study.
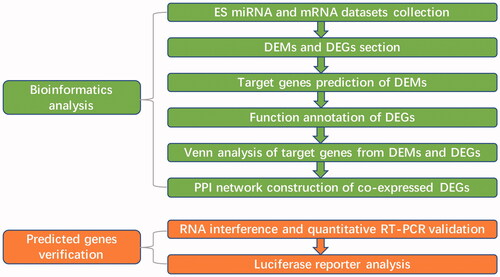
Table 1. The information of expression profiles.
Table 2. The primers of miRNAs and mRNA.
Figure 2. Overview of aberrantly expressed miRNAs in ES. The Volcano plots of miRNA expression. Each point represented one miRNA. The red points (up-regulated) and green points (down-regulated) indicated the change in miRNA expression of more than 2.0-fold.
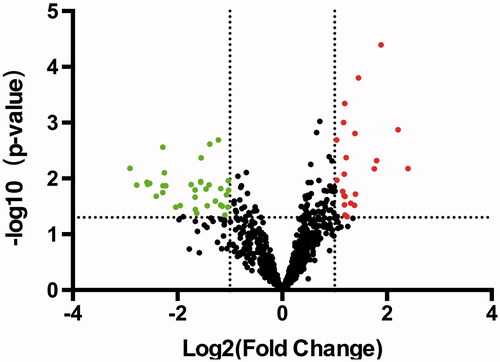
Table 3. The differential expressed miRNAs and mRNAs of the downloaded expression profiles.
Figure 3. The interactive network of 10 most up- and down-regulated miRNAs. (A) The interactive network consists of 10 most down-regulated miRNAs and 135 predicted target mRNAs. The red circle and blue diamond respectively represent miRNAs and target mRNAs. Solid lines represent relationship between two nodes. (B) The interactive network consists of 10 most up-regulated miRNAs and 60 predicted target mRNAs.
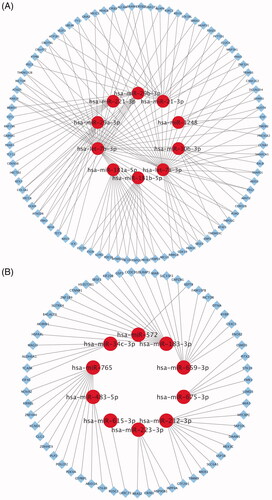
Figure 4. GO analysis of up-regulated DEGs in ES. The GO annotation included biological process, cellular component and molecular function.
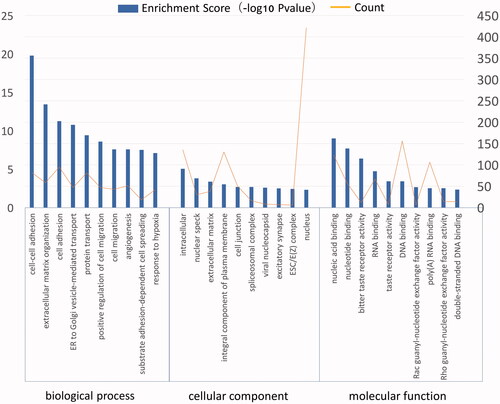
Figure 5. Kyoto Encyclopedia of Genes and Genomes (KEGG) enrichment analysis of up-regulated DEGs. The gradual colour represents the p values; the size of the black spots represents the gene number.
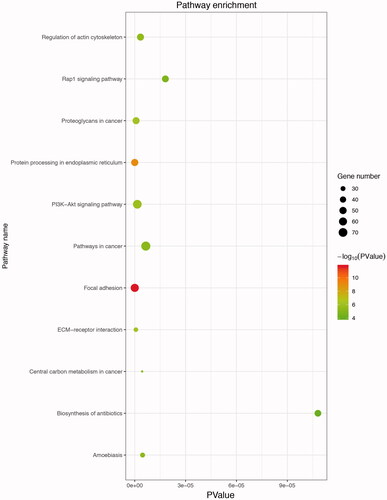
Figure 6. The Venn analysis of up- and down-regulated DEGs. (A) The Venn analysis of down-regulated DEGs and predicted up-regulated miRNAs target mRNAs display 2 co-expressed DEGs. (B) The Venn analysis of up-regulated DEGs and predicted down-regulated miRNAs target mRNAs shows 20 co-expressed DEGs.
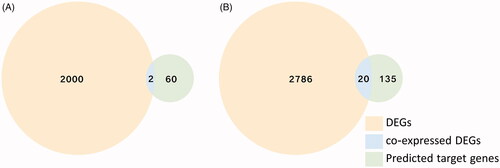
Table 4. The co-expressed DEGs of GSE68776 gene expression profile and predicted target genes.
Figure 7. The protein-protein interaction (PPI) networks of co-expressed up- and down-regulated DEGs. (A) The PPI networks of 20 co-expressed up-regulated DEGs. (B) The PPI networks of 2 co-expressed down-regulated DEGs.
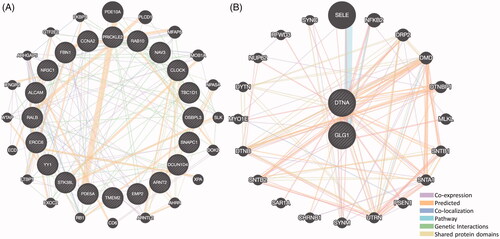
Figure 8. miR-21 probable target binding site of 3′-UTR of ALCAM. The vertical lines represented binding sites of miR-21 in the 3′UTR of ALCAM.
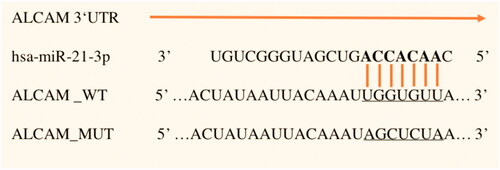
Figure 9. The expression of miR-21 in Ewing sarcoma cell lines. The expression levels of miR-21 were lower in each ES cell line contrasted with hMSC cell line by quantitative real-time PCR analysis.
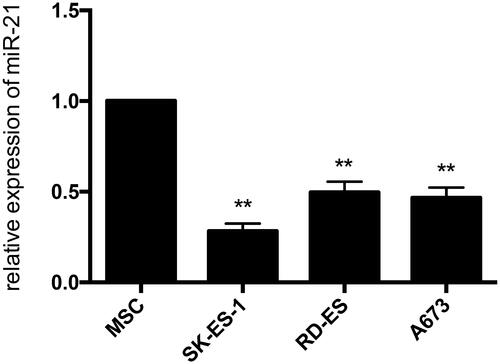
Figure 10. Validation of miR-21 and related mRNA ALCAM in three human Ewing sarcoma cell lines after transfecting mimics, mimics control, inhibitor and inhibitor control. (A,B) The expression of miR-21 was suppressed significantly and the expression levels of ALCAM were high in each ES cell line after treating with miR-21-3p inhibitor. (C,D) The expression levels of miR-21 and ALCAM were respectively up and down-regulated in ES cells after transfecting with miR-21-3p mimics; *p < 0.05; **p < 0.01.
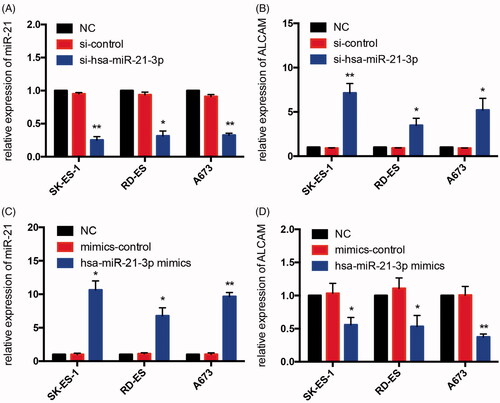
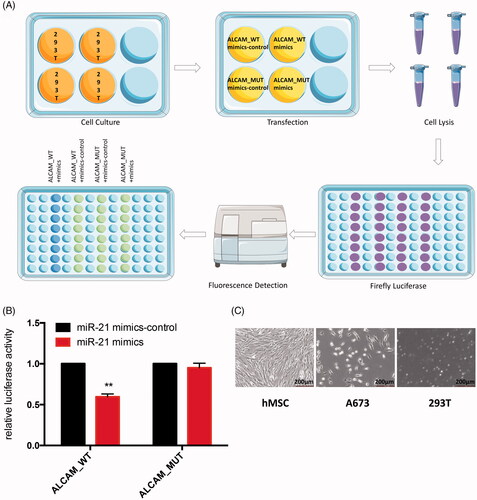
Figure 11. (A) Schematic diagram of luciferase reporter assay. The green dots represent stronger fluorescence signal, the blue dots represent weak fluorescence signal. (B) Relative luciferase activity of indicated ALCAM reporter constructs in 293 T cells. Transfection of miR-21 suppressed the activity of the luciferase reporter which contained the 3′-UTR of ALCAM significantly but did not influence the luciferase activity of the mutated 3′-UTR structure in 293 T cells. **p < .01. (C) Microscopic observation of hMSC cell line, A673 cell line and 293 T cells.