Figures & data
Figure 1. Chemical structure of salvianolic acid B. Molecular formula: C36H30O16; Average mass: 718.61.
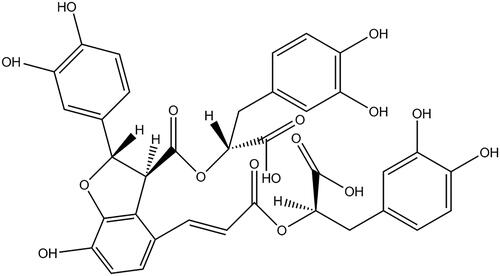
Figure 2. OGD induced H9c2 cells damage. (A) Cell viability was assessed with CCK-8. (B) A Western blot of cyclin D1 was represented with normalization to β-actin. (C) Apoptotic cells were observed with a flow cytometry after stain with Annexin V-FITC/PI. (D) Western blots of apoptosis-related proteins were suggested with normalization to β-actin. H9c2 cells were stimulated with OGD for 2 h. **p < .01 or ***p < .001 compared with the normoxia control. OGD: oxygen and glucose deprivation; CCK-8: cell counting kit-8; FITC/PI: fluorescein isothiocyanate/propidium iodide.
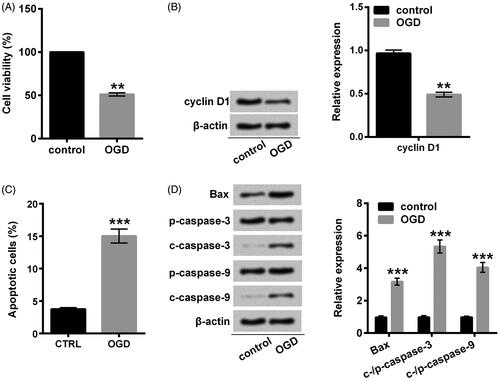
Figure 3. Sal-B protected H9c2 cells against OGD-induced damage. (A) Cell viability was assessed with CCK-8. H9c2 cells were stimulated with OGD for 2 h before pre-incubation with Sal-B at indicated concentrations. (B) A Western blot of cyclin D1 was represented with normalization to β-actin. (C) Apoptotic cells were observed with a flow cytometry after stain with Annexin V-FITC/PI. (D) Western blots of apoptosis-related proteins were suggested with normalization to β-actin. H9c2 cells were stimulated with OGD for 2 h before pre-incubation with Sal-B (10 μM) for 24 h. ns: p > .05, **p < 0.01 or ***p < .001 compared with the normoxia control. #p < .05 or ##p < .01 compared with the OGD-treated group. Sal-B: salvianolic acid B; OGD: oxygen and glucose deprivation; CCK-8: cell counting kit-8; FITC/PI: fluorescein isothiocyanate/propidium iodide; ns: not significant; c: cleaved; p: pro.
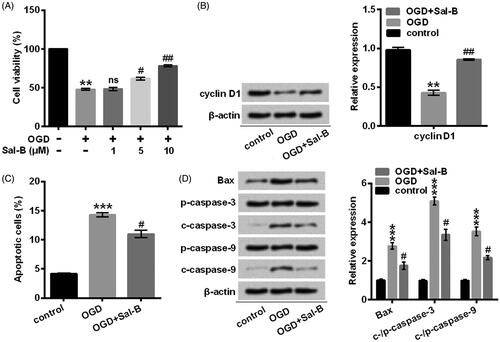
Figure 4. OGD-induced MEG3 overexpression was repressed by Sal-B. Relative expression of MEG3 was detected with qRT-PCR method in H9c2 cells stimulated with or without OGD for 2 h and/or pre-incubated with Sal-B (10 μM) for 2 h. **p < .01 compared with the normoxia control. #p < .05 compared with the OGD-treated group. MEG3: maternally expressed gene 3; OGD: oxygen and glucose deprivation; Sal-B: salvianolic acid B; qRT-PCR: quantitative reverse transcription PCR.
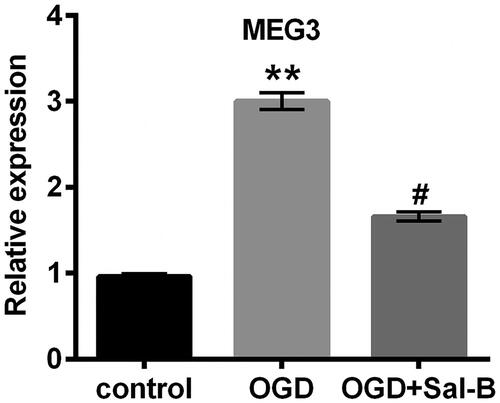
Figure 5. MEG3 overexpression abolished the protective effects of Sal-B against OGD-induced H9c2 cells damage. (A) MEG3 was determined with qRT-PCR after transfection with pMEG3 or not. ns: p > .05 compared with the normoxia control. ##p < .01 compared with the OGD-treated group. (B) Cell viability was assessed with CCK-8. H9c2 cells were stimulated with OGD for 2 h before pre-incubation with Sal-B at indicated concentrations. (C) A Western blot of cyclin D1 was represented with normalization to β-actin. (D) Apoptotic cells were observed with a flow cytometry after stain with Annexin V-FITC/PI. (E) Western blots of apoptosis-related proteins were suggested with normalization to β-actin. H9c2 cells were stimulated with OGD for 2 h before pre-incubation with Sal-B (10 μM) for 24 h. ns: p > .05, **p < .01 or ***p < .001 compared with the normoxia control. #p < .05 or ##p < .01 compared with the OGD-treated group. Xp < .05 or XXp < .01 compared with the OGD + Sal-B + pEX-2 group. CCK-8: cell counting kit-8; FITC/PI: fluorescein isothiocyanate/propidium iodide; MEG3: maternally expressed gene 3; OGD: oxygen and glucose deprivation; Sal-B: salvianolic acid B; MEG3: maternally expressed gene 3; ns: not significant; OGD: oxygen and glucose deprivation; Sal-B: salvianolic acid B; c: cleaved; p: pro; qRT-PCR: quantitative reverse transcription PCR.
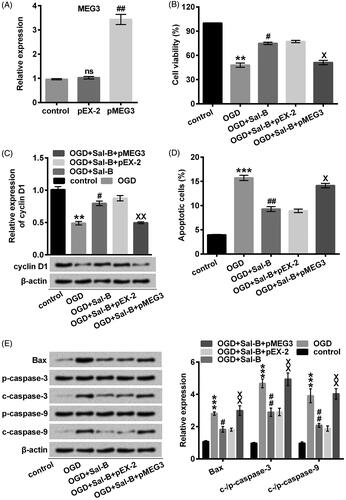
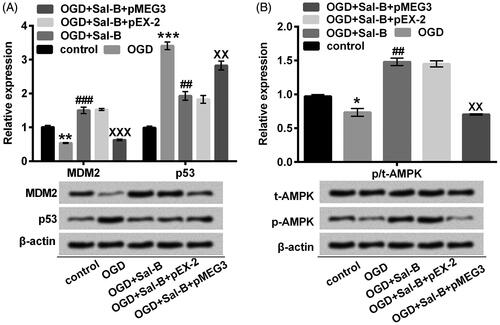
Figure 6. MEG3 overexpression reversed the modulatory effects of Sal-B on MDM2/p53 and AMPK signaling pathways in OGD-treated H9c2 cells. (A) MDM2, p53, (B) t-AMPK and p-AMPK were quantified with Western blot assay. H9c2 cells were stimulated with OGD or not for 2 h before pre-incubation with or without Sal-B (10 μM) for 24 h. *p < .05, **p < .01 or ***p < .001 compared with the normoxia control. ##p < .01 or ###p < .001 compared with the OGD-treated group. XXp < .01 or XXXp < .001 compared with the OGD + Sal-B + pEX-2 group. MEG3: maternally expressed gene 3; MDM2: murine double minute 2; AMPK: adenosine monophosphate activated protein kinase; OGD: oxygen and glucose deprivation; Sal-B: salvianolic acid B; p: phosphor; t: total.