
Figures & data
Figure 1. Selection process for eligible articles in this meta-analysis.
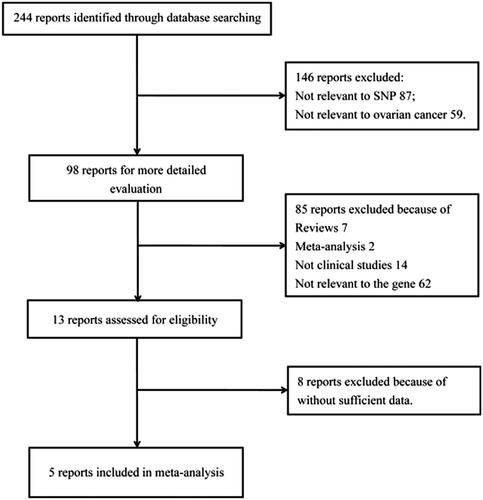
Table 1. Principal characteristics of the studies included in the Meta-analysis.
Figure 2. Forest plot for ovarian cancer risk associated with EPHX1 polymorphism rs1051740 under CC vs. TT model stratified by ethnicity. The squares and horizontal lines correspond to study-specific OR and 95% CI. The area of the squares reflects the weight (inverse of the variance). Diamond represents the summary OR and 95% CI.
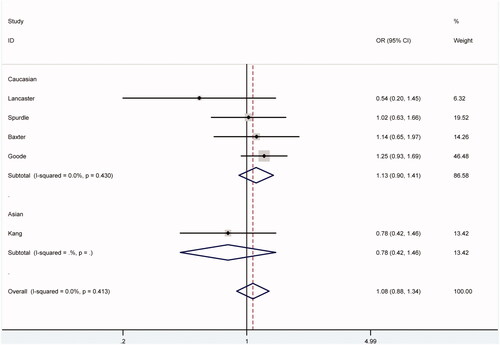
Table 2. EPHX1 Polymorphism rs1051740 and ovarian cancer risk.