Figures & data
Figure 1. Schematic presentation of MgO and MnO2 nanoparticles synthesis: (A1) Chamomile plant (Matricaria chamomilla L.), (A2) Fresh flowers of chamomile (Matricaria chamomilla L.), (A3) Dried flowers of chamomile (Matricaria chamomilla L.), (A4) Ground dried flowers of chamomile (Matricaria chamomilla L.), (B) Filtered aqueous flower extract of chamomile (Matricaria chamomilla L.), (C) MgO solution, (D) MnO2 solution, (BC) Synthesized MgO nanoparticles, (BD) Synthesized MnO2 nanoparticles, (E) Dried MgO nanoparticles, (F) Dried MnO2 nanoparticles.
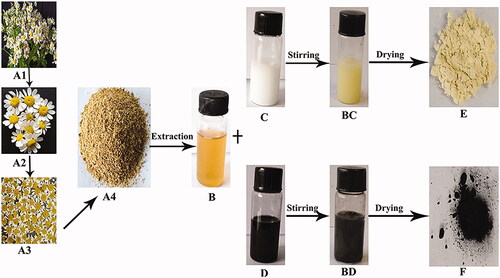
Figure 2. UV–Vis spectra of nanomaterials synthesized by flower extract of chamomile (Matricaria chamomilla L.) *Mg4 - MgO nanoparticles, Mn4 - MnO2 nanoparticles.
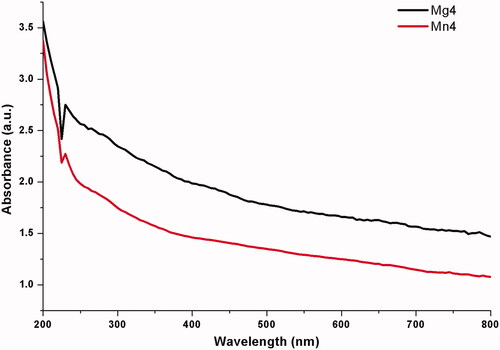
Figure 3. Fourier transform infrared spectra of nanomaterials synthesized by flower extract of chamomile (Matricaria chamomilla L.) of (A) MgO nanoparticles, (B) MnO2 nanoparticles.
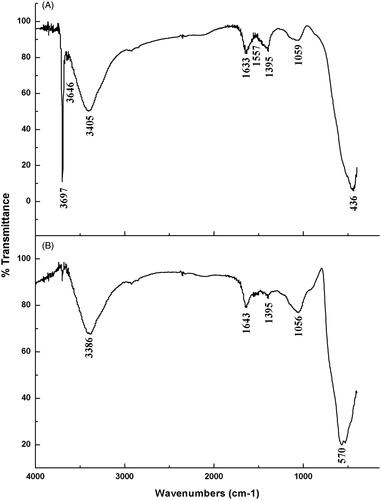
Figure 4. Transmission electron micrographs of synthesized nanomaterials of (A) MgO nanoparticles (D) Manganese dioxide nanoparticles. Magnification 50,000X, Bar = 100 nm for A and 15,000X, Bar = 1 µm for D and Scanning electron micrographs of synthesized nanomaterials of (B and C) Magnesium oxide nanoparticles (E and F) Manganese dioxide nanoparticles.
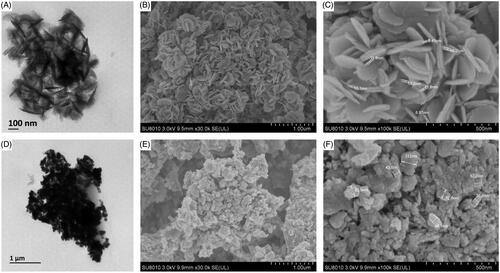
Figure 5. XRD spectra of synthesized nanomaterials (A) Magnesium oxide nanoparticles (D) Manganese dioxide nanoparticles and EDS profile of synthesized nanomaterials of (B and C) Magnesium oxide nanoparticles (E and F) Manganese dioxide nanoparticles.
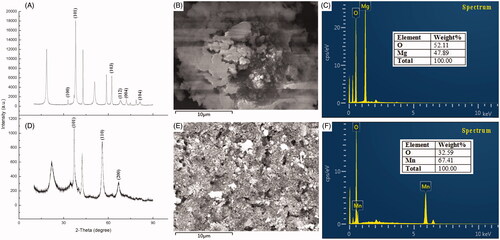
Figure 6. (A) Antibacterial activity of synthesized nanomaterials against Acidovorax oryzae strain RS-2. (B) Effect of synthesized nanomaterials on the growth of A. oryzae strain RS-2. Plates are showing inhibition zones of A. oryzae strain RS-2. *Mg + 4 magnesium oxide nanoparticles; Mn + 4 manganese dioxide nanoparticles. *Values are a mean ± standard error of three replicates and bars with the same letters are not significantly different in LSD test (p < .05).
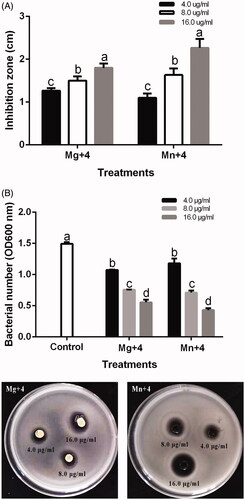
Figure 7. (A) Effect of synthesized nanomaterials on biofilm formation of Acidovorax oryzae strain RS-2. (B) Effect of synthesized nanomaterials on the swimming motility of A. oryzae strain RS-2 of *Mg + 4 magnesium oxide nanoparticles; Mn + 4 manganese dioxide nanoparticles. *Values are a mean ± standard error of three replicates and bars with the same letters are not significantly different in LSD test (p < .05).
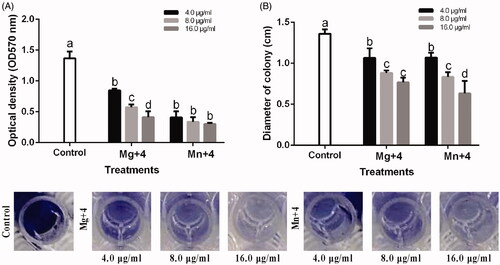
Figure 8. (A) Effect of the nanomaterials on the efflux of cytoplasmic materials on Acidovorax oryzae strain RS-2. (B) TEM images of A. oryzae strain RS-2. Magnification 150,000X for control and Mg + 4; 200,000X for Mn + 4; Bar = 200 nm *Mg + 4 magnesium oxide nanoparticles; Mn + 4 manganese dioxide nanoparticles. *Values are a mean ± standard error of three replicates and bars with the same letters are not significantly different in LSD test (p < .05).
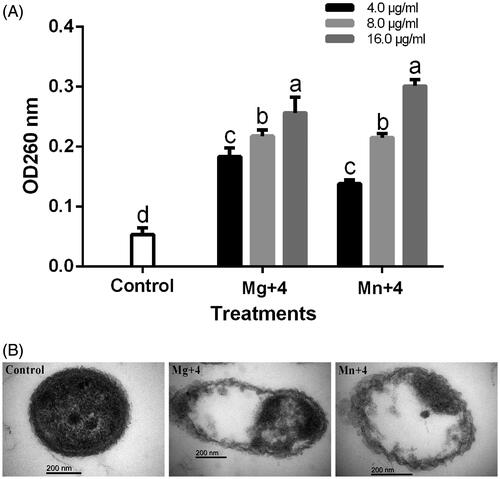
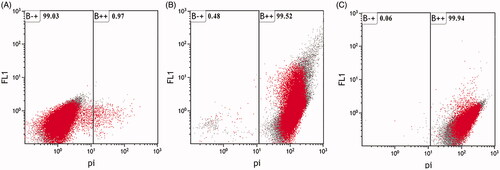
Figure 9. Flow cytometry images of Acidovorax oryzae strain RS-2 after incubation with (A) double distilled water (Control) (B) magnesium oxide nanoparticles (C) manganese dioxide nanoparticles.