Figures & data
Figure 1. 53BP1-based delivery platforms. (A) Multicomponent transferrin-53BP1 delivery platform. The first component (transferrin) provides cell internalization function, the second (a 53BP1 fragment) provides a foci-binding function, and the third (streptavidin) is the model payload. Transferrin and 53BP1 are linked by a scissile disulfide bond. Other features include a nuclear localization sequence (NLS), biotin (B) molecules bound to the tetrameric streptavidin, and covalently linked Alexa Fluor 488 (stars). (B) PTD-53BP1 delivery platform. A protein transduction domain (PTD) is fused to the primary sequence of 53BP1 to provide cell internalization function. Other symbols are as in Panel A. (C) Overall scheme showing internalization, photochemical release, nuclear uptake, foci binding, and recycling of transferrin to the cell surface.
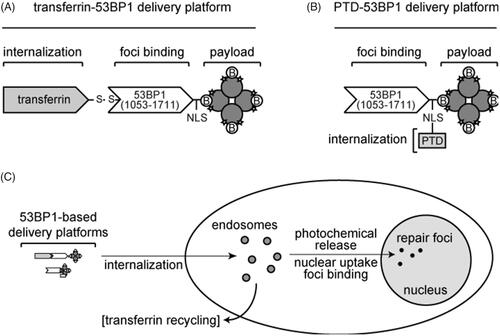
Figure 2. Characterization of expressed 53BP1 (1053–1711) fragment. (A) Scale diagram of 53BP1. Expressed fragment contains tandem Tudor domains and oligomerization domains, but not C-terminal BRCT domains found in native 53BP1. (B) Co-electrophoresis assays to detect H4K20me2 peptide binding. Reactions contained 7.6 μM BSA, 1.0 μM 53BP1 fragment, or H4K20me2 peptide (4.2, 11.7, 23.4, or 46.8 μM). Immunoblotting with anti-H4K20me2 and Ponceau staining for total protein are shown, with ratios plotted (arbitrary units) in bottom panel. Dashed lines indicate background in the absence of peptide for each of the 53BP1 fragments. (C) Pull-down assays to detect H4K20me2 peptide binding. Indicated peptides were conjugated to agarose resin, incubated with 53BP1 fragments, and bound protein was analyzed by SDS-PAGE with Coomassie blue staining. Lanes labeled “on” contain 2 μg of input protein (equivalent to 10% of total input). Other lanes contain 30% of protein solubilized from each resin. Markers are indicated in kDa. (D) Streptavidin-agarose pull-down. SDS-PAGE analysis shows 10% of total input (T), 10% of free protein (F), and 10% of bound protein (B). Proteins were analyzed on a 4–12% Nu-PAGE SDS gel with Coomassie blue staining with markers indicated in kDa.
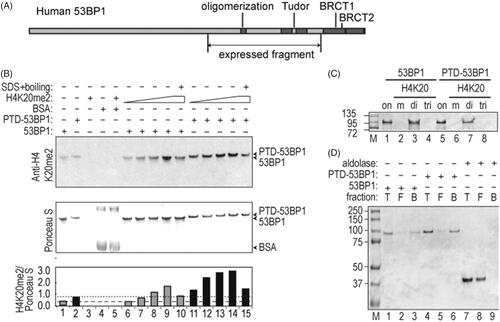
Figure 3. Assembly of transferrin-53BP1 delivery platform. (A) Gel filtration chromatogram of transferrin-53BP1 conjugation reaction. Absorbance at 280 nm (A280) is indicated in milliabsorbance units (mAU). Conjugate and free transferrin (tf) peaks are indicated. (B) SDS-PAGE analysis of fractions from panel A. Migration of 53BP1 fragment, reduced tf, and non-reduced tf are indicated. Loading buffer contained β-mercaptoethanol (β-ME) as indicated.
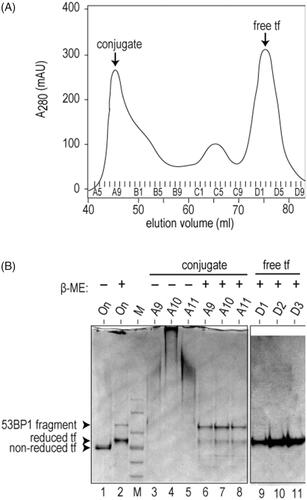
Figure 4. Cell uptake of transferrin-53BP1 and PTD-53BP1 platforms. Columns show differential interference contrast (DIC) or staining with Hoechst 33342 (DNA), FM4-64 (endosomes) or Alexa Fluor 488 (53BP1-streptavidin). Rows are labeled to indicate which 53BP1-based delivery platform was tested. For the competition experiment with free transferrin, cells were preincubated for 30 min with medium containing 20 μM transferrin competitor, this was replaced with pre-warmed medium containing 5 μg/ml FM4-64 (Invitrogen) for 1 min, and this was replaced with medium containing Tf-53BP1 complex, FM4-64, and 20 μM transferrin. Control experiments (bottom two rows) were performed with FM4-64 and streptavidinAlexafluor 488 only (“no 53BP1”), or with 53BP1 fragment lacking both transferrin and PTD (“53BP1 (no tf, no PTD)”). Scale bars, 15 μm.
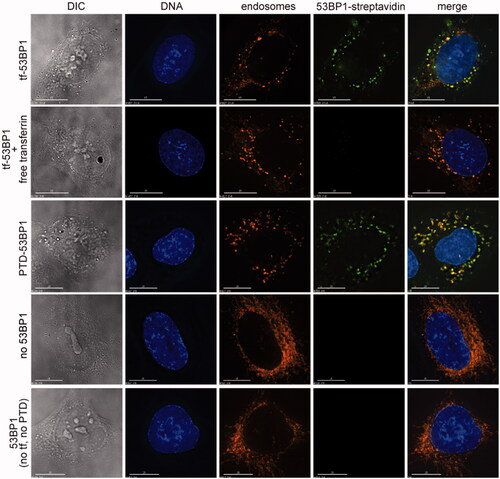
Figure 5. Photochemical release and nuclear uptake. Cells were incubated with indicated transferrin-53BP1 or PTD-53BP1 delivery platforms. Far-red light excitation was as indicated. AlPcS2a was detected based on its intrinsic fluorescence; other columns are as in .
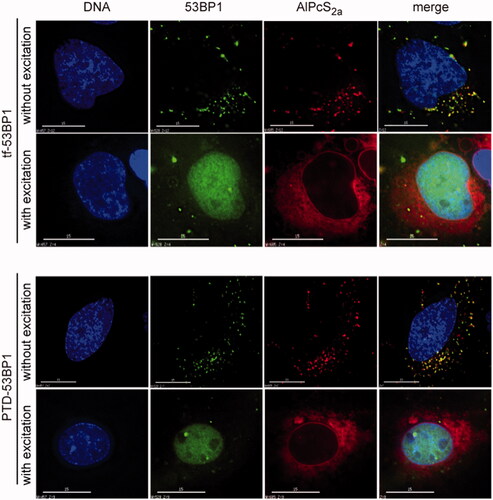
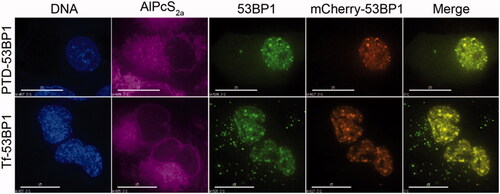
Figure 6. Localization of 53BP1-streptavidin complexes to repair foci. Cells were transfected with mCherry53BP1 expression plasmid(23) to establish a reference for foci formation, then with indicated transferrin-53BP1 or PTD-53BP1 delivery platforms. Cells were treated with 2 Gy of 137Cs radiation, and then live cell imaging was performed. Columns are labeled as in Figure 4, with the inclusion of a mCherry channel and merge channel which merged 53BP1-streptavidin and mCherry-53BP1 images. Note that AlPcS2a has been assigned a purple color to distinguish from mCherry. Scale bars, 15 μm.