Figures & data
Figure 1. (A) Varaiation of particle size and zeta potential as a function of CM ratio (SLN/ICG to CM protein, w/w). Each sample was repeated in triplicate and shown as mean ± SD (B) Western blot analysis of two proteins (AT1R and CXCR4) in CM and CM/SLN/ICG. (C) TEM images of SLN/ICG, CM and CM/SLN/ICG. Scale bar: 100 nm.
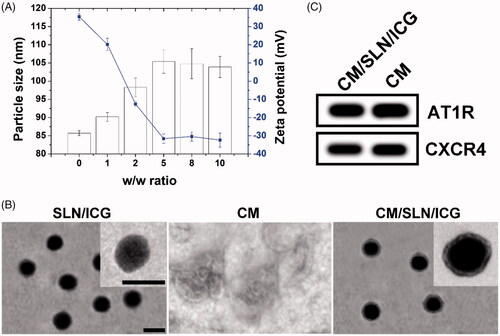
Figure 2. (A) The stability of CM/SLN/ICG under physiological environments for 48 h. (B) The fluorescence stability of CM/SLN/ICG upon light irradiation. Each sample was repeated in triplicate and shown as mean ± SD.
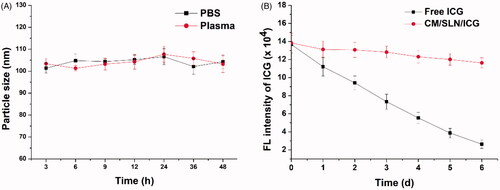
Figure 3. (A) The comparative photothermal conversion profile of CM/SLN/ICG. PBS was employed as control. (B) The drug release of CM/SLN/ICG under different pH conditions (7.4 and 5.5). Each sample was repeated in triplicate and shown as mean ± SD.
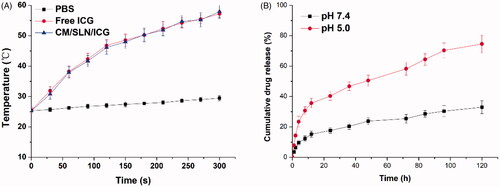
Figure 4. (A) Biocompatibility of drug free CM/SLN in 143B cells. (B) Cytotoxicity of free ICG, SLN/ICG and CM/SLN/ICG (with laser irritation) at different ICG concentrations against 143B cells after 48 h incubation. Inserted images demonstrated the normal and cleaved caspase-3 levels in three groups (ICG concentration: 5 μg/mL). Each sample was repeated in triplicate and shown as mean ± SD.
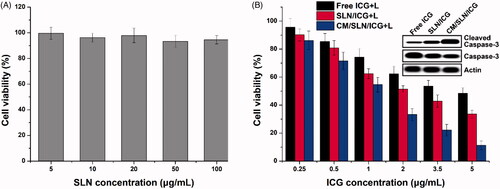
Figure 5. (A) The comparative intracellular time-dependent uptake of different formulations in 143B cells (pretreated with/without CM). (B) The drug localization of signal injection of SLN/ICG and CM/SLN/ICG for 48 h. Each sample was repeated in triplicate and shown as mean ± SD.
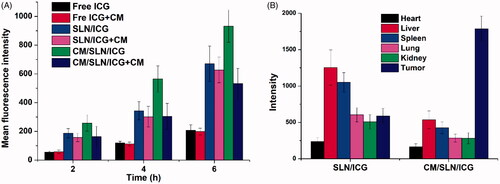
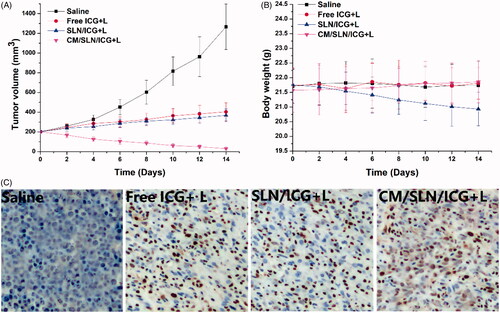
Figure 6. The in vivo antitumour assay of CM/SLN/ICG. (A) and (B) represent the time-dependent tumour volume and body weight, respectively, of mice treated with different formulation. (C) represents the TUNEL staining (200×) of tumour tissue at the end of therapy. Each sample was repeated in sextuplicate and shown as mean ± SD.