Figures & data
Figure 1. Characterization of miR-185 enriched MSC-EVs. (A) Isolated miR-185 MSC-EVs were characterized by TEM. Representative image is shown (scale bar = 50 nm). (B) NTA was performed on the EVs to determine their concentration and size. EV diameter was measured and represented as mean ± SD, n = 3 independent experiments performed in triplicate. Western blotting (insets) for EV markers CD9, CD81 and flotillin-1. (C) qPCR analysis for expression of miR-185 in EVs. n = 5 independent experiments performed in triplicate (**p < .01 versus Ctrl).
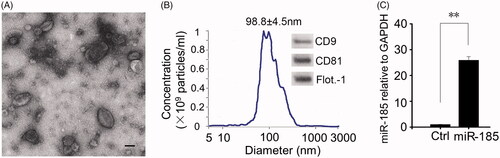
Figure 2. EVs binding abilities. (A) Binding of miR-185 MSC-EVs to buccal mucosa. miR-185 enriched MSC-EVs were prelabelled with PKH26 red dye and pasted on mucosa surface of lesion in hamsters. Images were captured at 12 h after the treatment and tissue distribution of PKH26 stained EVs was evaluated by fluorescent microscopy (blue indicates DAPI, red indicates PKH26-stained EVs, scale bar = 50 μm). Most fluorescent red staining was localized in the epithelial layer of the mucosa (insets). (B) Intercellular internalization of miR-185 MSC-EVs to OSCC cells (Cal27). Cal27 cells were incubated with PKH26 labelled miR-185 MSC-EVs for 12 h and cellular localization of PKH26 fluorescence was evaluated by fluorescent microscopy. Cal27 cells were incubated with unstained EVs as a negative control (blue indicates DAPI, red indicates PKH26-stained EVs). Images shown are representative of five independent experiments (scale bar = 20 μm).
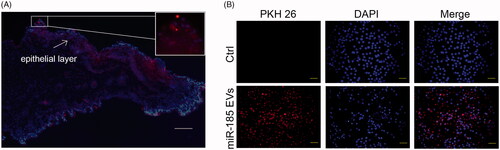
Figure 3. MiR-185 MSC-EVs delay the progression of OPMD in DMBA-induced hamsters. (A) Schematic diagram of miR-185 MSC-EVs treatment in a DMBA induced OPMD hamster model. (B) Representative gross images of the hamster buccal mucosa on weeks 0, 3, and 6 of DMBA exposure (upper, white arrows indicate inflammatory exudation (middle) and white patches (right)). Representative gross images of in vitro buccal tissue (lower). (C) Serum from blood collected at the time of sacrifice was assayed for the level of ALT, AST, Scr and BUN.
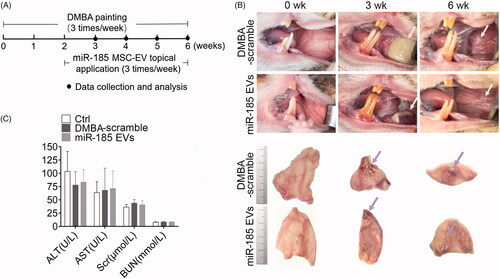
Figure 4. MiR-185 MSC-EVs suppress inflammation. (A) Inflammatory cells in buccal sections were stained with H&E (left, dotted squares indicate the area with dense inflammatory cells of buccal mucosa painted with DMBA, 10 sections per animal, n = 5 in each group, scale bar = 50 μm) and then quantified (right, miR-185 EVs versus DMBA-scramble, *p < .05). (B) Protein array analysis showing altered expression of cytokines and chemokines in buccal tissue (left) and quantification (right). Numbers above the X axis indicate partial pro-inflammatory cytokines and chemokines, and numbers below the X axis indicate partial anti-inflammatory cytokines and chemokines. (C) Serum concentrations of IL-6, IL-1β and IL-10 were assessed by ELISA (n = 5 in each group, miR-185 EVs versus DMBA-scramble, *p < .05, **p < .01). (D) The protein levels of IL-6 and IL-1β, and pathway-related protein of Akt, p-Akt, NF-κB and p-NF-κB in buccal tissue were determined by Western blotting (left) and quantified (right, n = 5 in each group, miR-185 EVs versus DMBA-scramble, *p < .05, **p < .01).
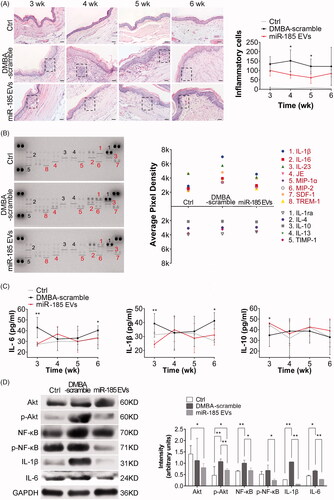
Figure 5. MiR-185 MSC-EVs alleviate pathological features and inhibit proliferation and angiogenesis. (A) Representative images of histopathological grading in buccal sections by H&E staining (arrows indicate the location of hyperplasia, dotted squares indicate the location of typical dysplasia with partially magnified images (right), 10 sections per animal, n = 5 in each group, scale bar = 50 μm (100 μm for Ctrl)). (B) Incidence of dysplasia on weeks 3, 4, 5 and 6 of DMBA exposure (n = 5 in each group, **p < .01). (C) Hyperplasia and dysplasia were quantified and visualized by scatter-plot diagram (n = 5 in each group, *p < .05). (D) IHC analysis of PCNA and CD31 protein expression levels in buccal sections. Homogenous brown nuclear and vascular endothelial staining indicate respectively the positive expression for PCNA and CD31 (upper, arrows indicate positive expression, scale bar = 50 μm). Staining was then quantified (lower, MOD: mean optical density, MVD: microvessel density determined by CD31 staining, n = 5 in each group, miR-185 EVs versus DMBA-scramble, *p < .05, **p < .01). (E) The protein levels of PCNA and VEGFA in buccal tissue were determined by Western blotting (upper) and then quantified (lower, n = 5 in each group, **p < .01).
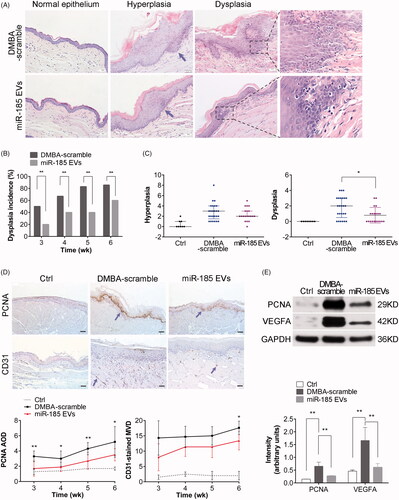
Figure 6. MiR-185 MSC-EVs induce apoptosis. (A) Apoptotic cells in buccal sections were determined by TUNEL assay (10 sections per animal, green indicates apoptotic bodies, blue indicates DAPI-stained nuclei, scale bar = 20 μm). Positive (apoptotic) cells were quantified (right, n = 5 in each group, *p < .05). (B) Pro-caspase-9, cleaved caspase-9, pro-caspase-3 and cleaved caspase-3 protein levels in buccal tissue were assessed by Western blotting (left) and were quantified (right, n = 5 in each group, *p < .05, **p < .01).
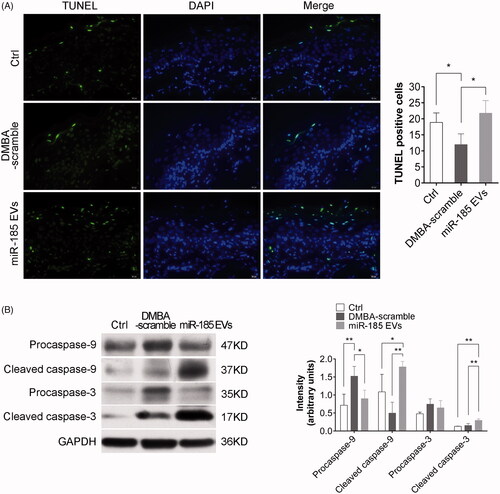
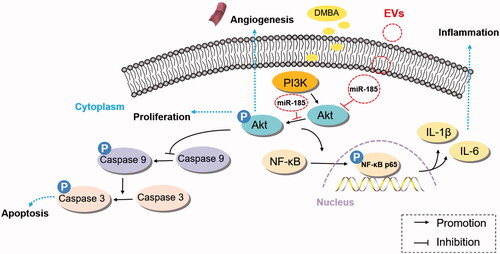
Figure 7. Schematic representation of the mechanism by which miR-185 encapsulated by MSC-EVs ameliorates OPMD by inhibition of inflammation and induction of apoptosis via Akt/NF-κB and Akt/caspase-9 related pathways.