Figures & data
Figure 1. LPS induced WI-38 cell injury. (A) Cell viability by CCK-8 assay. (B) Cell migration by Transwell assay. (C) Cell apoptosis by flow cytometry. (D) Expression of apoptosis-associated proteins by Western blot analysis. Data presented are the mean ± SEM of at least three independent experiments. *p < .05; **p < .01; ***p < .001. C/P-: cleaved/pro; MW: molecular weight.
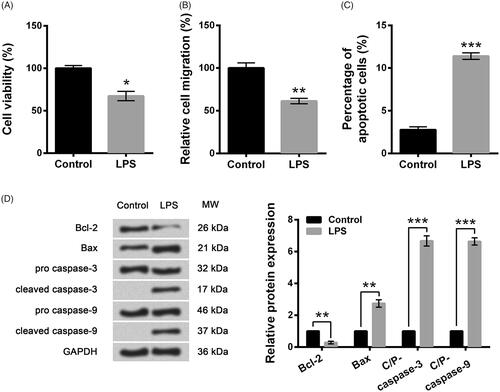
Figure 2. Long non-coding RNA MEG3 was down-regulated by LPS treatment. Expression of MEG3 in WI-38 cells (A) and human PMVECs (B) was assessed by qRT-PCR. Data presented are the mean ± SEM of at least three independent experiments. **p < .01.
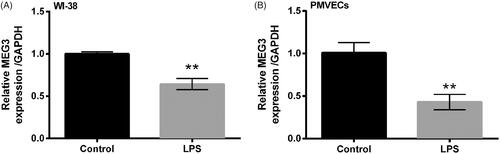
Figure 3. Knockdown of long non-coding RNA MEG3 aggravated LPS-induced injury of lung cells. (A) Expression of MEG3 by qRT-PCR. (B) Cell viability by CCK-8 assay. (C) Cell migration by Transwell assay. (D) Cell apoptosis by flow cytometry. (E) Expression of apoptosis-associated proteins by Western blot analysis. Data presented are the mean ± SEM of at least three independent experiments. *p < .05; **p < .01; ***p < .001. P-: pro; C-: cleaved; C/P: cleaved/pro; MW: molecular weight.
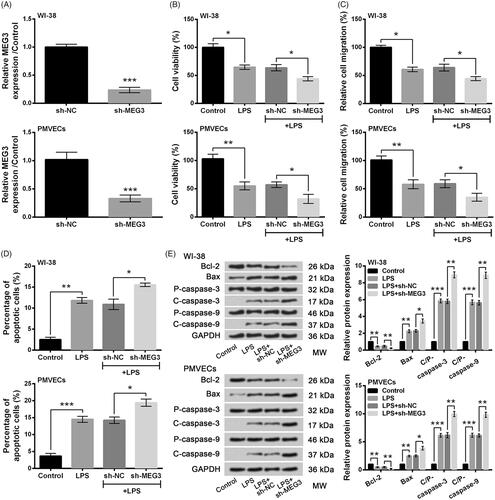
Figure 4. MiR-4262 was negatively correlated with long non-coding RNA MEG3 expression. (A) Expression of MEG3 by qRT-PCR. (B) Luciferase activity by luciferase reporter assay. Data presented are the mean ± SEM of at least three independent experiments. *p < .05; **p < .01.
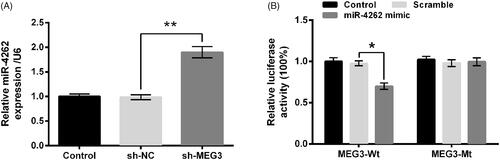
Figure 5. Effects of long non-coding RNA MEG3 silence on LPS-induced WI-38 cell injury were alleviated by miR-4262 inhibition. (A) Expression of miR-4262 by qRT-PCR. (B) Cell viability by CCK-8 assay. (C) Cell migration by Transwell assay. (D) Cell apoptosis by flow cytometry. (E) Expression of apoptosis-associated proteins by Western blot analysis. Data presented are the mean ± SEM of at least three independent experiments. *p < .05; **p < .01; ***p < .001. P-: pro; C-: cleaved; C/P: cleaved/pro; MW: molecular weight; NC: negative control of miR-4262 inhibitor.
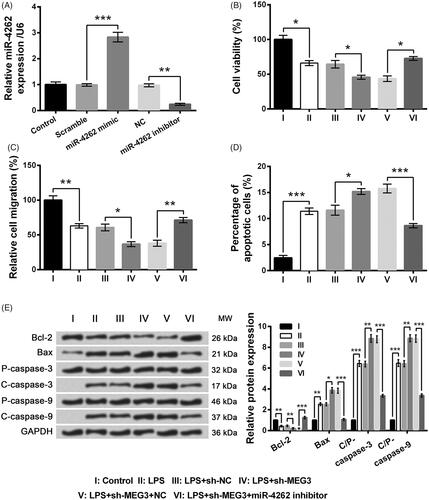
Figure 6. MiR-4262 negatively regulated the expression of KLF4 in WI-38 cells. Expression levels of mRNA (A) and protein (B) were assessed by qRT-PCR and Western blot analysis, respectively. Data presented are the mean ± SEM of at least three independent experiments. *p < .05; **p < .01. NC: negative control of miR-4262 inhibitor; MW: molecular weight.
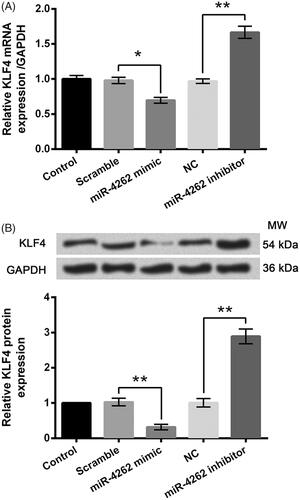
Figure 7. LPS-induced WI-38 cell injury was ameliorated by KLF4 overexpression but was aggravated by KLF4 knockdown. (A) Expression of KLF4 by qRT-PCR and Western blot analysis. (B) Cell viability by CCK-8 assay. (C) Cell migration by Transwell assay. (D) Cell apoptosis by flow cytometry. (E) Expression of apoptosis-associated proteins by Western blot analysis. Data presented are the mean ± SEM of at least three independent experiments. *p < .05; **p < .01; ***p < .001. P-: pro; C-: cleaved; C/P: cleaved/pro; MW: molecular weight.
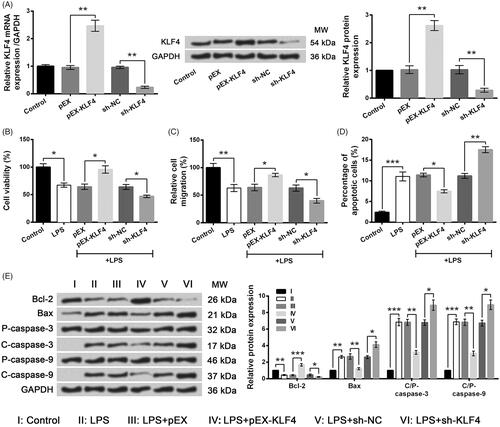
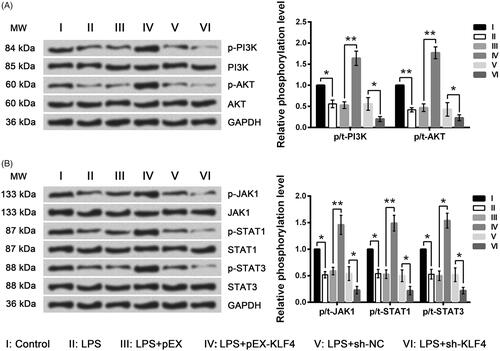
Figure 8. LPS-induced inhibition of the PI3K/AKT and JAK/STAT signaling pathways was further inhibited by KLF4 knockdown but was reversed by KLF4 overexpression. Expression of key kinases involved in the PI3K/AKT (A) and JAK/STAT (B) signaling pathways was assessed by Western blot analysis. MW: molecular weight.