Figures & data
Figure 1. TEM images of rGO nanosheets (a) and DLS analysis of rGO nanosheets (b).
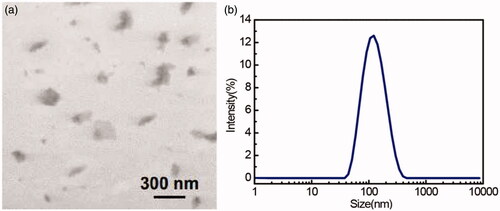
Figure 2. AFM images of bare GO (a), EDC-NHS activated GO (b), antibody conjugated GO (c) on freshly cleaved mica, and corresponding height profiles of the line scans (arrows shown in a,b,c) (d).
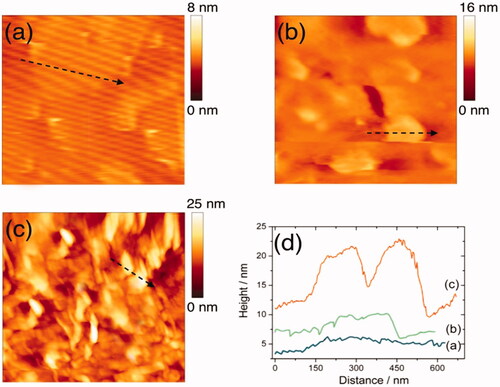
Figure 3. In vitro release profile of SF from rGO nanoparticles.
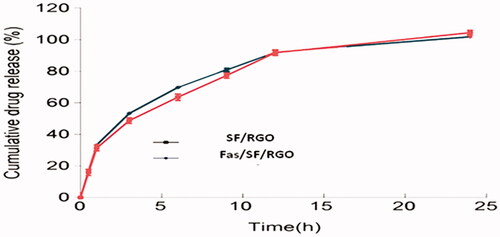
Table 1. Encapsulation efficiency percentage and drug loading percentage of SF/FL/rGO.
Figure 4. Immunoblot images representing corresponding signals of neurovascular damage measured 24 h after MCAO with nano conjugates treatment. Mice on Akt and ERK signalling.
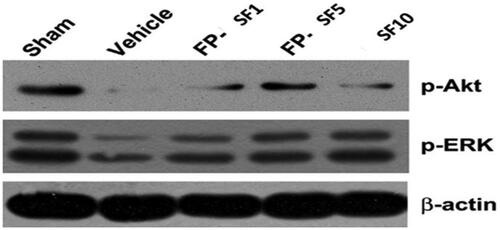
Figure 5. Quantified data for the changes of protein expression after vehicle, regular SF (10 mg/kg), and FP-SF (1 or 5 mg/kg) treatment in MCAO mice (Right panel). Immunodetection of β-lactin was used as a loading control. The data values are expressed as the mean SEM (n = 4). **p < .01 versus sham mice; #p < .05, ##p < .01 versus vehicle mice; §p<.05 versus regular SF treated mice, FP-SF, and SF encapsulated Fas ligand/rGO nanoconjugate.
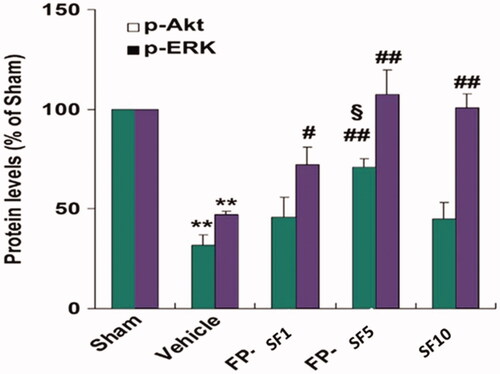
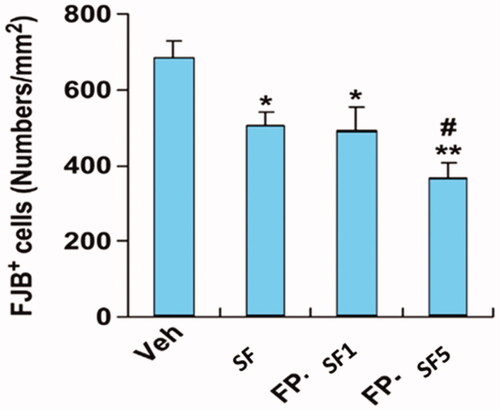
Figure 6. Effect of SF conjugated Fas ligand/rGO nanoconjugate on Fluoro-Jade B staining. The number of Fluoro-Jade B-stained cells was scored and quantified. The graph is the average values of brain sections after vehicle, regular SF (10 mg/kg), and FP-SF (1 or 5 mg/kg) treatment following MCAO. The data are expressed as the mean ± SEM (n = 8). *p < .05, **p < .01 versus vehicle mice; #p < .05 versus regular SF treated mice. FP-SF, SF encapsulated Fas ligand/rGO-nanoconjugate.