Figures & data
Figure 1. (A) The SEM image of blue-SiNPs. Spherical shape and 43–56 nm; (B) FTIR spectrum of blue-SiNPs (top) and blue-SiNP-NH2 (bottom). The band at 2945 cm−1 in the blue-SiNP-NH2 is assigned to the N–H of the silica; (C) The SEM image of PMNPs, 58–72 nm, uniform and spherical; (D) FTIR spectrum of Fe3O4-TEOS (top) and Fe3O4-TEOS-APTMS (bottom). The band at 2923 cm−1 is assigned to C–H of the Fe3O4-TEOS-APTMS. The band at 3450 cm−1 refers to the N–H stretching vibration. Bands around 3430.7 and 1630 cm−1 are assigned to amide groups.
Figure 2. Condition optimization results for rapid colorimetric detection of B. abortus, (A) PMNPs and blue-SiNP-NH2 optimization results, optimum concentration of PMNPs 5 mg and blue-SiNP-NH210 mg were determined; (B) 5 μL was the optimized concentration of the antibody; (C) Time optimization results, best time for conjugation of antibody with EDC/NHS complex was calculated as 240 min; (D) Optimized time for conjugated of bacteria with nanoparticles was 60 min.
Figure 3. (A) Visual results of the colorimetric assay by serial dilutions of the B. abortus from 1.5 × 10⁸ to 1.5 × 10 cfu mL−1, by reducing the concentration of bacteria the intensity of the color decreases; (B) A linear dependence between the dye absorbance and logarithm of B. abortus concentration.
Figure 4. Specificity of the colorimetric immunoassay. From left to right, PBS (0.01 mol mL−1), Brucella abortus 544 (1.5 × 10⁸ cfu mL−1), Brucella melitensis 16 M (1.5 × 10⁸ cfu mL−1), Escherichia coli O:157 (1.5 × 10⁸ cfu mL−1), Salmonella typhimurium (1.5 × 10⁸ cfu mL−1), Yersinia enterocolitica O:9 (1.5 × 10⁸ cfu mL−1), Staphylococcus aureus (1.5 × 10⁸ cfu mL−1), Stenotrophomonas maltophilia (1.5 × 10⁸ cfu mL−1).
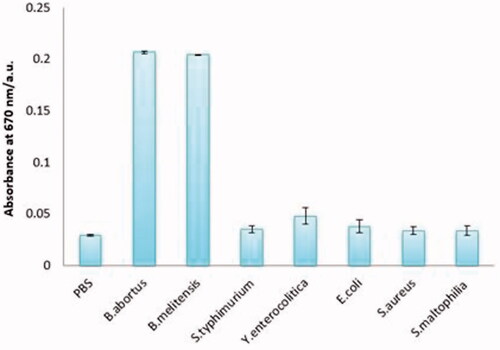
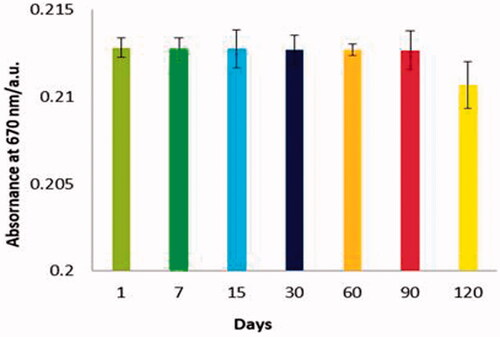
Figure 5. Results of stability analysis of nanosensor on days 1, 7, 15, 30, 60, 90, and 120. During this time, the components had acceptable stability.