
Figures & data
Figure 1. ATDC5 cells injury evoked by LPS. (A) The viability of ATDC5 cells was measured using CCK-8 assay, after treating with various concentrations of LPS (n = 3). Different letters above the columns indicate the significant difference (ANOVA combined with Duncan post-hoc test). The cells were treated by 6 μg/mL LPS, after which (B) apoptotic cell rate, (C) expression of proteins associated with apoptosis, (D) mRNA and (E) protein levels of pro-inflammatory cytokines, as well as (F) the release of the cytokines were measured using flow cytometry, western blot, qRT-PCR and ELISA (n = 3). *p < .05 (Student t-test).
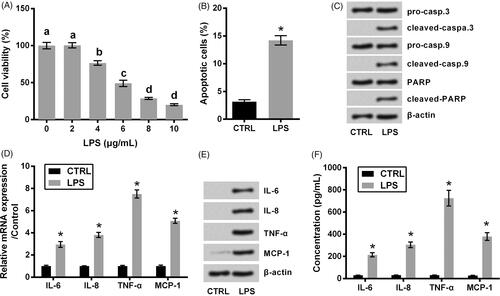
Figure 2. Protective function of MIAT silence against LPS challenge in ATDC5 cells. (A) Relative expression of MIAT in ATDC5 cells was measured using qRT-PCR, after treating with various concentrations of LPS. Different letters above the columns indicate the significant difference. (B) Relative expression of MIAT was measured using qRT-PCR, after transfection with sh-MIAT, pc-MIAT or negative controls (sh-NC and pcDNA3.1). The transfected cells were then subjected to 6 μg/mL LPS, after which (C) cell viability, (D) apoptotic cell rate, (E) expression of proteins associated with apoptosis, (F) mRNA and (G) protein levels of pro-inflammatory cytokines, as well as (H) the release of the cytokines were measured using CCK-8 assay, flow cytometry, western blot, qRT-PCR and ELISA (n = 3). *p < .05 (ANOVA combined with Duncan post-hoc test).
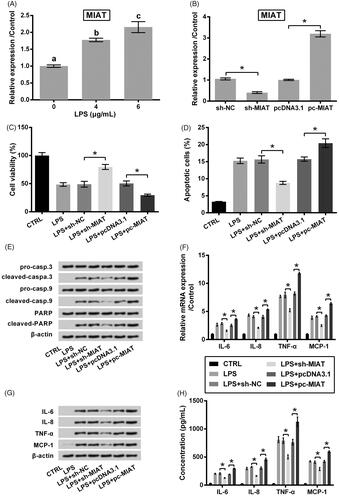
Figure 3. Chondroprotective effects of MIAT silence through up-regulating miR-132. (A) Relative expression of miR-132 in ATDC5 cells was measured using qRT-PCR, after transfection with sh-MIAT, pc-MIAT or negative controls (sh-NC and pcDNA3.1). (B) Relative expression of miR-132 was measured using qRT-PCR, after transfection with miR-132 inhibitor or NC. The transfected cells were then subjected to 6 μg/mL LPS, after which (C) cell viability, (D) apoptotic cell rate, (E) expression of proteins associated with apoptosis, (F) mRNA and (G) protein levels of pro-inflammatory cytokines, as well as (H) the release of the cytokines were measured using CCK-8 assay, flow cytometry, western blot, qRT-PCR and ELISA (n = 3). *p < .05 (ANOVA combined with Duncan post-hoc test or Student t-test).
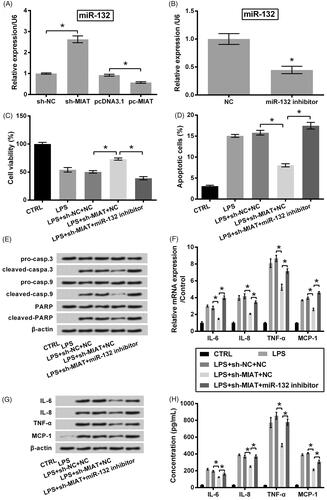
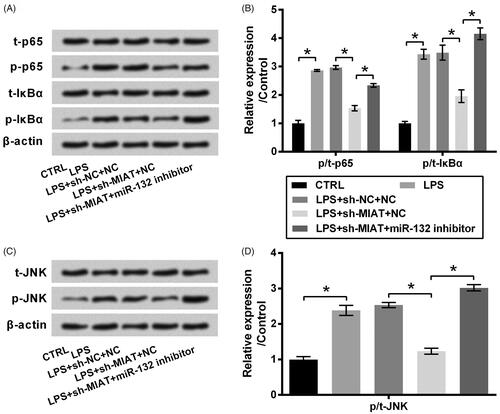
Figure 4. Suppressive effect of MIAT silence on the activation of NF-κB and JNK pathways via miR-132. ATDC5 cells were co-transfected with sh-MIAT and miR-132 inhibitor and then subjected to 6 μg/mL LPS. The phosphor/total (p/t) levels of (A,B) p65, IκBα and (C,D) JNK were measured using western blot (n = 3). *p < .05 (ANOVA combined with Duncan post-hoc test).
Data availability statement
The datasets used and/or analyzed during the current study are available from the corresponding author on reasonable request.