Figures & data
Figure 1. Characterization of FITC-VHP-Fe3O4@SiO2. (a) The morphology of Fe3O4@SiO2 with different magnification under TEM (left: the scale bar is 0.2 μm; right: the scale bar is 50 nm). (b) FITR analyse of SiO2 (black line), FITC (green line), VHPKQHR (blue line) and FITC-VHP-Fe3O4@SiO2 (red line).
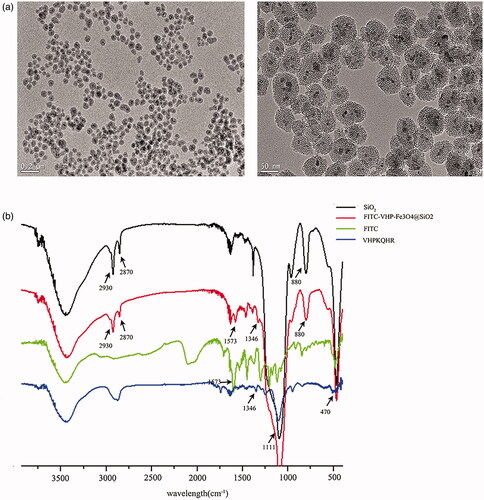
Figure 2. The binding ability of FITC-VHP-Fe3O4@SiO2 to endothelial cells with high expression of VCAM-1. (a) FITC-Fe3O4@SiO2, FITC-ACTH-Fe3O4@SiO2 and FITC-VHP-Fe3O4@SiO2 were incubated with stimulated MAECs and observed under confocal microscope. (b) The FITC fluorescence intensity corresponding to confocal microscope was calculated using Image J software. (c) The fluorescence intensity of MAECs after incubation with FITC-VHP-Fe3O4@SiO2 for 0, 0.5, 1, 2 h was analyzed by flow cytometry. ***p < .001.
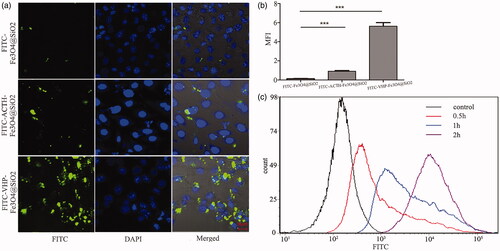
Figure 3. Biosafety of FITC-VHP-Fe3O4@SiO2 in vitro. (a) The hemolysis rate under FITC-VHP-Fe3O4@SiO2 for 10, 25, 50, 100, 200 μg/ml. (b) CCK8 was used to assess the effect of 10, 25, 50, 100, 200 μg/ml FITC-VHP-Fe3O4@SiO2 on viability of MAECs and Raw264.7. *p < .05; **p < .01; ##p < .01; ###p < .001.
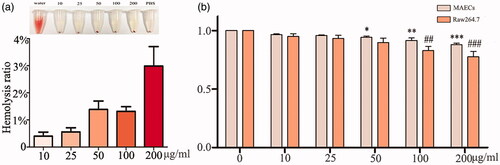
Figure 4. FITC-VHP-Fe3O4@SiO2 can target atherosclerotic plaques ex vivo and in vivo. T2 signal intensity (a) and T2 value (b) before and after treatment with FITC-Fe3O4@SiO2, FITC-ACTH-Fe3O4@SiO2 and FITC-VHP-Fe3O4@SiO2 for 24 h. The fluorescence intensity distribution of blood vessels (c) and Quantitative analysis of fluorescence intensity (d) was measured using a Small Animal Multi-mode Imaging System after injecting with FITC-Fe3O4@SiO2, FITC-ACTH-Fe3O4@SiO2 and FITC-VHP-Fe3O4@SiO2 for 24 h. * p < .05
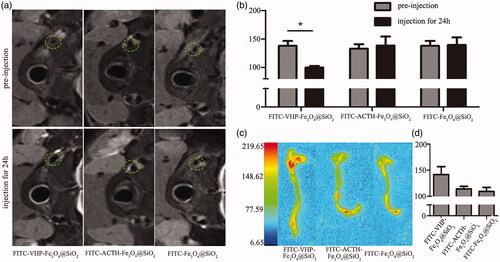
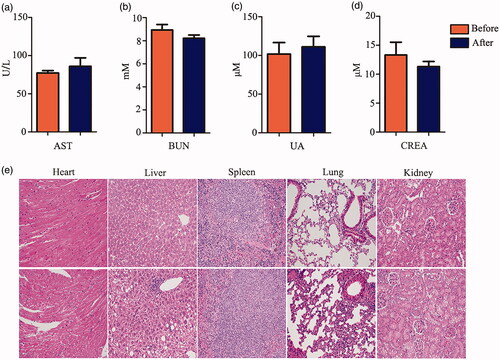
Figure 5. In vivo toxicity assessment. Measurement of AST, BUN, UA, CREA content in blood (a–d) and HE staining of heart, liver, spleen, lung and kidney (e) before and after injection for 15 days.