
Figures & data
Figure 1. Characterization of HA-Se@PTX. (A) Particle size distribution of HA-Se@PTX. (B) TEM image of HA-Se@PTX. (C) EDX analysis of HA-Se@PTX. (D) Stability analysis of HA-Se@PTX in aqueous solution.
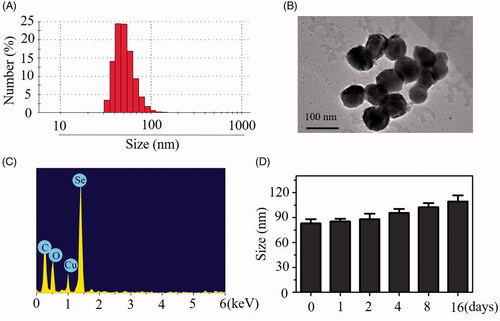
Figure 2. Cellular uptake of HA-Se@PTX in A549 cells (A) and HUVEC (B) was observed by fluorescence microscope, respectively. Scale bar is 20 μm. (C) Quantitative uptake of SeNPs, HA-SeNPs and HA-Se@PTX in A549 cells was analyzed by ICP-MS. (D) The uptake of HA-Se@PTX in A549 cells untreated/pretreated with HA were tested by ICP-MS.
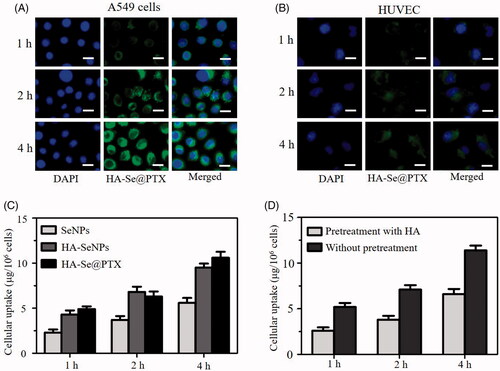
Figure 3. (A) Effect of temperature and endocytosis inhibitors on the internalization of HA-Se@PTX in A549 cells. *p < .05, **p < .01 vs. control group. (B) In vitro release of PTX from HA-Se@PTX nanoparticles. **p < .01 vs. pH5.4 group.
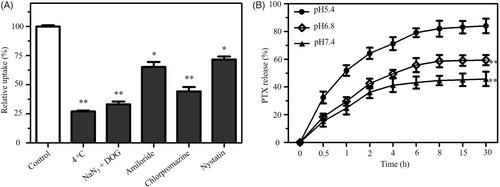
Figure 4. (A) The cytotoxicity of PTX, Se@PTX and HA-Se@PTX at various PTX equivalent concentrations against A549 cells. (B) The cytotoxicity of HA-SeNPs against A549 cells. *p < .05, **p < .01 vs. PTX group.
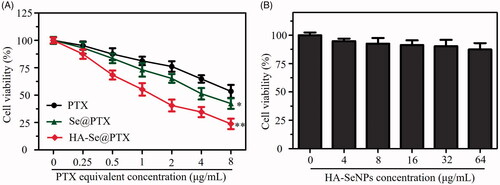
Figure 5. (A) The wound width of A549 cells was photographed after 12 h of co-incubation with PTX, Se@PTX and HA-Se@PTX, respectively. Scale bar is 400 µm. (B) The quantitative analysis of cell motility in control, PTX, Se@PTX and HA-Se@PTX groups. (C) The effect of PTX, Se@PTX, and HA-Se@PTX on the migration of A549 cells. Scale bar is 200 µm. (D) The quantitative analysis of cell migration inhibition rate in PTX, Se@PTX, and HA-Se@PTX groups. *p < .05 vs. PTX group.
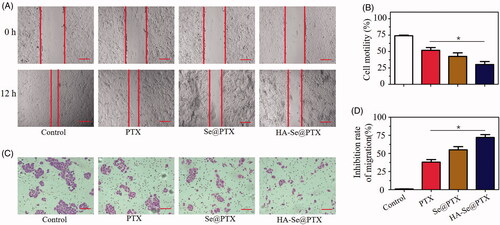
Figure 6. (A) Effect of PTX, Se@PTX, and HA-Se@PTX on the cell cycle distribution and apoptosis in A549 cells, respectively. (B) Apoptosis percentage analysis of A549 cells after exposed to PTX, Se@PTX, and HA-Se@PTX, respectively.
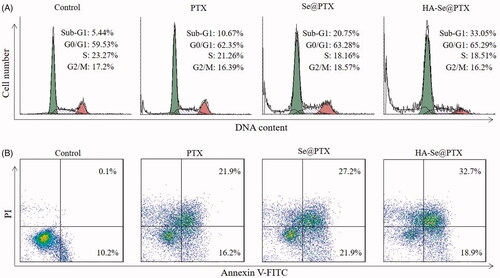
Figure 7. The protein expression of MMP-2, MMP-9, cleavage-caspase-3, and cleavage-PARP in A549 cells exposed to different concentrations of HA-Se@PTX.
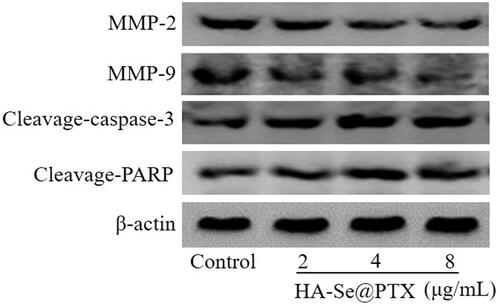
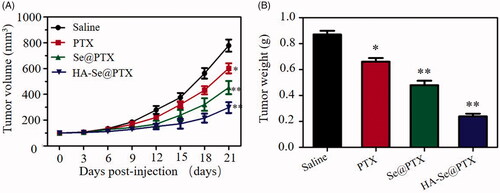
Figure 8. (A) Tumor volume changes of the mice after intravenous injection of saline, PTX, Se@PTX, and HA-Se@PTX. (B) Tumor weight analysis of mice after 21 days treatment. *p < .05, **p < .01 vs. saline group.