
Figures & data
Figure 1. Synthesis and characterization of silver nanoparticles (AgNPs) (A) UV spectra of AgNPs synthesized through chemical method showing strong peak at 425 nm (B) DLS analysis for the particle size of AgNPs. (C) TEM micrograph of AgNPs.
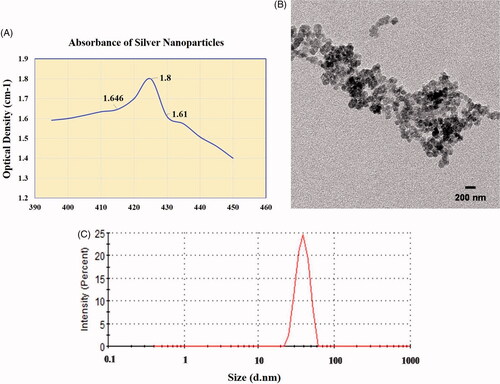
Figure 2. Pseudomonas aeruginosa gender wise distribution in pus samples and growth on plate and glass tube (A) Gender wise distribution of P. aeruginosa in pus samples. (B) Growth of P. aeruginosa on Cetrimide agar. (C) Biofilm formation through glass tube method.
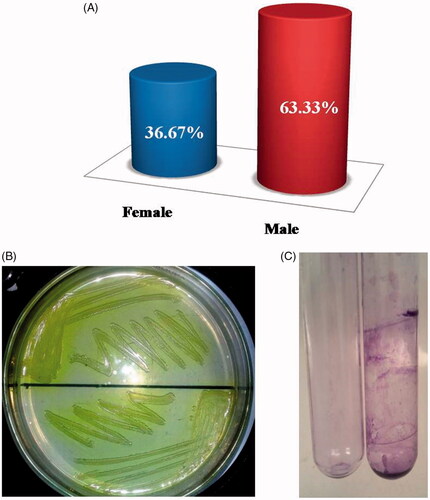
Figure 3. Minimum inhibitory concentration of Polymyxin B (A) MIC of Polymyxin B (Agar well diffusion method) (B) MIC of Polymyxin B against P. aeruginosa biofilm.
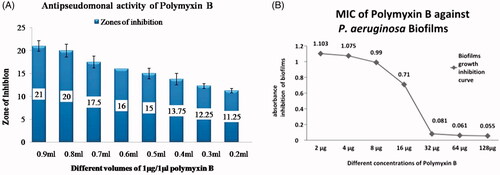
Figure 4. Zone of inhibition with antibiotics, nanoparticles and their synergistic activity.
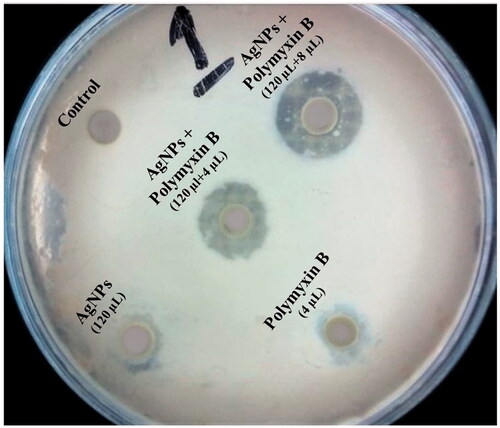
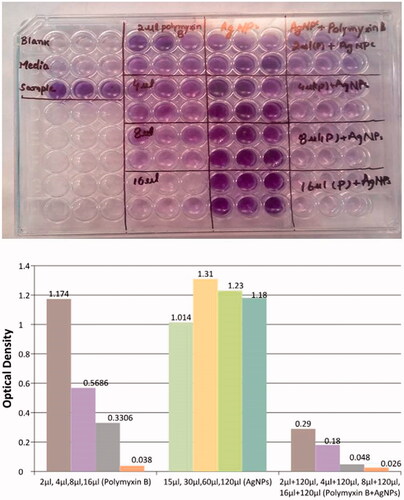
Figure 5. Optical density (OD) of biofilms in the presence of different concentrations of Polymyxin B, NPs and their synergistic activity.
Data availability
All the required data, which is related to current study, are embedded in this manuscript.