Figures & data
Figure 1. Screening for PCa-related circRNAs and mRNAs by microarrays. (A) Heatmap of differentially expressed circRNAs in PCa tissues and adjacent normal tissues. (B,C) Scatter plot showed dysregulated circRNAs in PCa tissues compared with adjacent normal tissues (FC≥ 2.0) and volcano plot showed significantly dysregulated circRNAs in PCa tissues compared with adjacent normal tissues (FC ≥ 2.0, p < .05). (D) Heatmap of differentially expressed mRNAs in PCa tissues and adjacent normal tissues. (E,F) Scatter plot showed dysregulated mRNAs in PCa tissues compared with adjacent normal tissues (FC≥ 2.0) and volcano plot showed significantly dysregulated mRNAs in PCa tissues compared with adjacent normal tissues (FC ≥ 2.0, p < .05). (G,H) Chromosomal distribution of the upregulated and downregulated circRNAs. (I) Types and counts of differentially expressed circRNAs detected by microarray (FC ≥ 2.0, p < .05). Green, downregulated genes; red, upregulated genes.
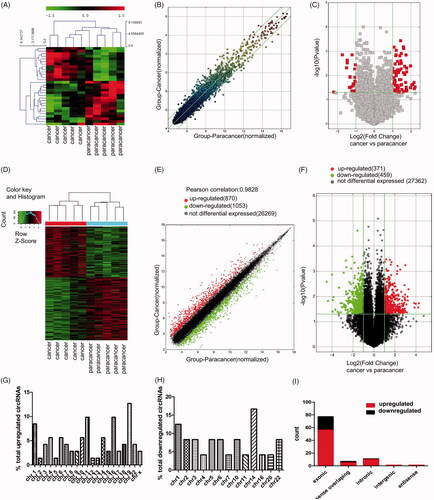
Figure 2. GO and KEGG analysis for circRNAs and mRNAs. (A) Biological process GO terms for host genes of circRNAs. (B) Cellular component GO terms for host genes of circRNAs. (C) Molecular function GO terms for host genes of circRNAs. (D) GO terms for up-regulated mRNAs. (E) GO terms for down-regulated mRNAs. (F) KEGG analysis of up-regulated mRNAs. (G) KEGG analysis of down-regulated mRNAs.
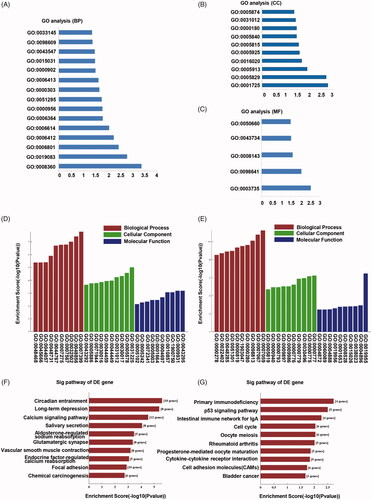
Figure 3. Co-expression network of 20 circRNAs with their associated mRNAs. Solid lines mean positive correlations, while dashed lines mean negative correlations. circRNA shape: ellipse, color: up-hot pink, down-dark olive-green; mRNA shape: triangle, color: up-yellow, down-sky-blue.
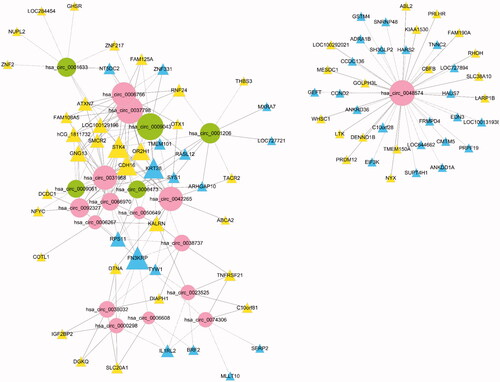
Figure 4. Validation of three circRNAs in PCa tissues and adjacent normal tissues by qRT-PCR and ROC curves. The probability values were calculated using the Wilcoxon paired t-test test or paired t-test, depending on data distributions. (A) Hsa_circ_0001633. (B) Hsa_circ_0001206. (C) Hsa_circ_0009061. (D) ROC curves for hsa_circ_0001633, hsa_circ_0001206, and hsa_circ_0009061. The results are presented as the mean ± SEM (n = 50). **p < .01, ***p < .001.
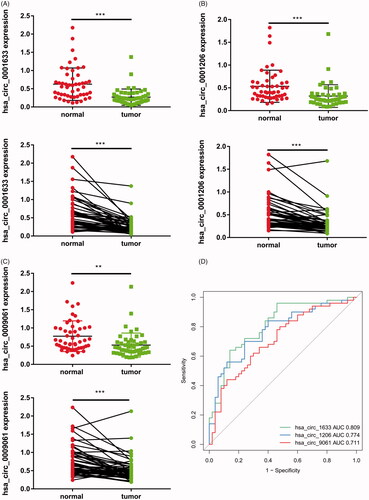
Table 1. CircRNA and mRNA Primers used for qRT-PCR analysis.
Table 2. Clinicopathological features of PCa patients and the expression of selected circRNAs.
Figure 5. Competing endogenous RNA network in PCa. The competing endogenous RNA network has been generated based on circRNA/miRNA/mRNA interactions. CircRNA shape: ellipse, color: dark olive -green; microRNA shape: rect, color: gray; mRNA Shape: triangle, color: up-yellow, down-sky-blue.
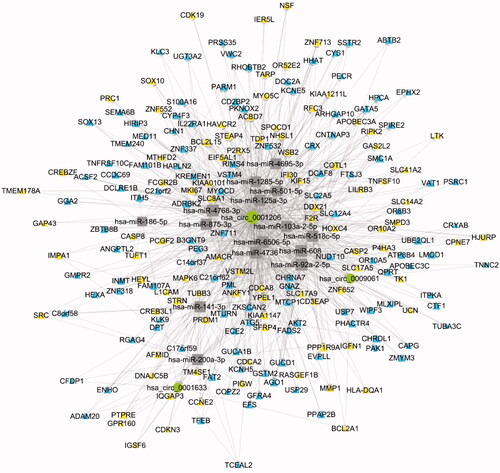
Table 3. The predicted miRNAs for selected circRNAs.
Figure 6. The expression of hsa_circ_0001206 in PCa cell lines and construction of hsa_circ_0001206-overexpressing cells. (A) Expression of hsa_circ_0001206 in RWPE-1, PC-3, DU145, and LNCaP cells (n = 3 repeats for each cell line). (B) The expression of hsa_circ_0001206 in hsa_circ_0001206-overexpressing DU145 cells and negative control DU145 cells detected by qRT-PCR. (C) The expression of hsa_circ_0001206 in hsa_circ_0001206-overexpressing PC-3 cells and negative control PC-3 cells detected by qRT-PCR. (D) Phase contrast and fluorescent images of hsa_circ_0001206-overexpressing cells (DU145 and PC-3) and negative control cells (DU145 and PC-3) at the fifth passage.
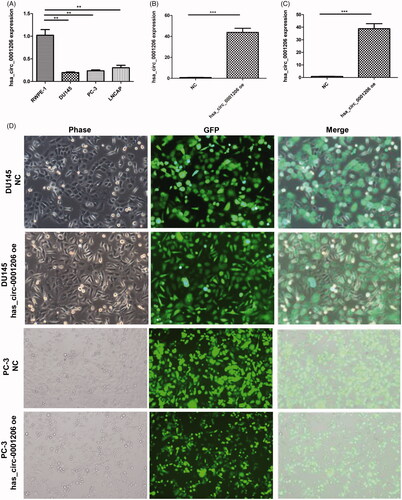
Figure 7. Overexpression of hsa_circ_0001206 inhibits the proliferation, migration, and invasion of PCa cells. (A) CCK-8 assay in DU145 cells. (B) CCK-8 assay in PC-3 cells. (C) Migration assays. (D) Invasion assays. Effective migrating or invading cells were counted and photographed. Original amplification, ×200. The histogram displays the quantitative analysis of migrating or invading cells. The results are presented as the mean ± SEM. *p < .05, **p < .01, ***p < .001.
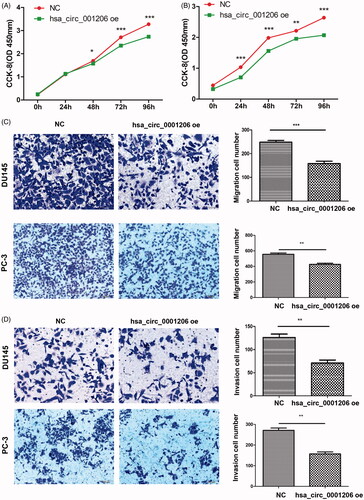
Figure 8. Hsa_circ_0001206 could directly interact with miR-1285-5p. (A) Sequences revealing specific binding sites between hsa_circ_0001206 and miR‑1285-5p. (B) Dual-Luciferase reporter assay. (C) Positive correlation between the expression of Smad4 mRNA and hsa_circ_0001206 in PCa tissue samples (n = 24) (R = 0.4348; p=.0337). (D) The expression level of Smad4 was induced by hsa_circ_0001206 overexpression, but the effect was partially reversed by miR-1285-5p mimic. (E) The GEPIA database revealed the mRNA expression of Smad4 was significantly downregulated in PCa tissues. The boxplot analysis showed log2 (TPM + 1) on a log-scale. (F) The disease-free survival of the PCa patients was computed with the GEPIA web tool. N = 3 independent experiments. The results are presented as the mean ± SEM. *p Values<.05, **p values <.01, ***p values <.001.
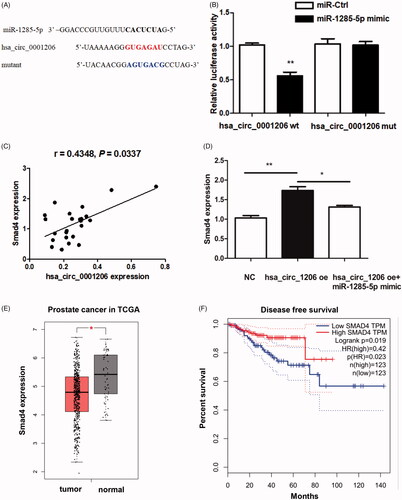
Figure 9. Hsa_circ_0001206 suppressed the growth of PCa in vivo. (A,B) The upper group represented negative control group, the other for hsa_circ_0001206 overexpressing group. (C,D) Tumor volumes and weights of two groups. (E,F) Western blot using xenograft tissues revealed that the protein expression of Smad4 was increased in the hsa_circ_0001206 overexpressing group compared with the control group. The histogram displays the quantitative analysis. The results are presented as the mean ± SEM. *p < .05.
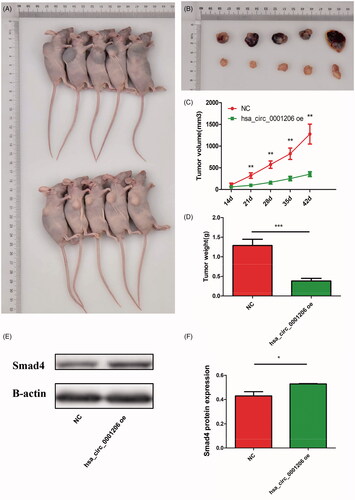
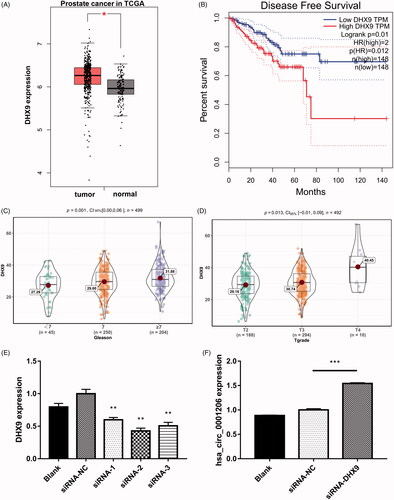
Figure 10. Knocking down of DHX9 could increase the expression of hsa_circ_0001006. (A) The GEPIA database revealed the mRNA expression of DHX9 was significantly up-regulated in PCa tissues. The boxplot analysis showed log2 (TPM + 1) on a log-scale. (B) The disease-free survival of the patients with PCa was computed with the GEPIA web tool. (C) The expression levels of DHX9 in PCa patients with different Gleason scores. (D) The expression levels of DHX9 in PCa patients with different tumor grades. (E) The expression of DHX9 in blank, negative control, and DHX9-siRNA transfected groups detected by qRT-PCR. (F) The expression of has_circ_0001206 in blank, negative control, and DHX9-siRNA2 transfected group detected by qRT-PCR. N = 3 independent experiments. The results are presented as the mean ± SEM. *p < .05, **p < .01, ***p < .001.