Figures & data
Table 1. Nucleotide sequences for real-time RT-PCR primers.
Figure 1. Characterization of canine BMSCs and TLR2 gene expression (a) The molecular surface epitopes in BMSCs assayed by flow cytometry. (b) Multilineage differentiation of canine BMSCs. (c, d) TLR2 expression in BMSCs was detected using Western blotting and immunofluorescence staining.
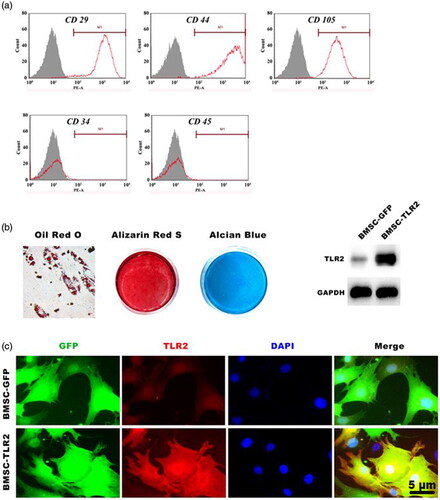
Figure 2. Real-time RT-PCR analysis. The expression of Runx2, ALP, OCN, and VEGF in BMSCs after PGN stimulating TLR2 signaling pathway in BMSCs was detected using real-time RT PCR. (★, p < .05; ★★, p < .01).
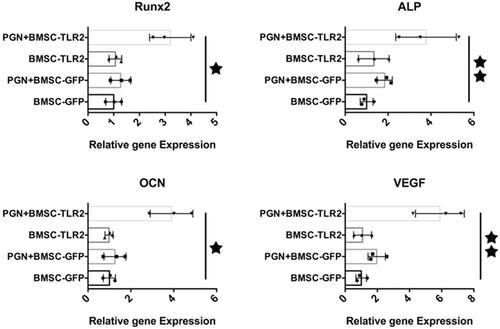
Figure 3. Effects of PGN on regulating TLR2-modified BMSCs osteogenic differentiation (a) ALP staining. (b) The expression of Hif-1α, VEGF, BMP-2 was detected using Western blotting. (c) OCN expression was detected using immunofluorescence staining.
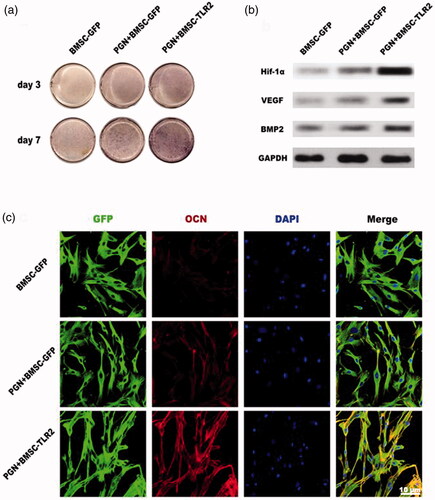
Figure 4. Ectopic osteogenesis and angiogenesis of BMSC-TLR2. (a) Schematic illustration of the experiment process. (b) Blood vessels formation in the implants were detected using fluorescence staining of CD31. (c) Osteogenic differentiation of transplanted cells was detected using fluorescence staining of OCN.
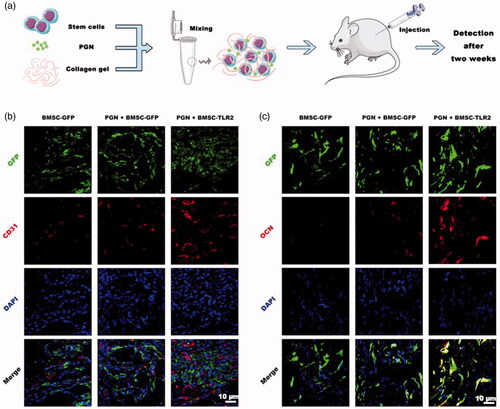
Figure 5. BMSC-TLR mediated bone regeneration in tooth extraction sockets. (a) Schematic illustration of the experiment process. (b) Micro-CT and histological analysis of the new bone formation. Upper panel, coronal view of Micro-CT scanning; Lower panel, Van Gieson’s Picrofuchsin staining. The newly formed bone appears red. (c, d) BMD and Tb.N statistic results according to the micro-CT assay (n = 6). (e) Histomorphometric analysis of the newly formed bone area in the tooth extraction sockets. (f) Sequential fluorescence labeling of the new bone formation. Red, Alizarin Red S (ARS); Yellow, Tetracycline (TE); and Green, Calcein (CA). (★, p < .05; ★★, p < .01).
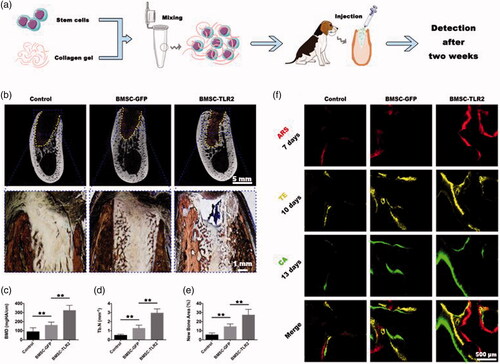
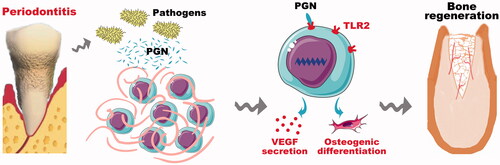
Figure 6. The schematic diagram displayed the mechanisms of TLR2 modified BMSCs promoting bone regeneration in peridontitis environment.