Figures & data
Table 1. Immunization administered to the groups of mice.
Figure 1. Purification and Western blot analysis of recombinant protein (A) Purified rEIT, 6X-His-tagged protein after elution with 250 mM imidazole. Lane 1, protein weight marker, Lane 2, 3, 4, 5 – Purified protein after elution with 40 mM imidazole. (B) Purified rStx2B, 6X-His-tagged protein after elution based on pH gradient under denaturing condition. Lane 1, Protein weight marker. Lane 2, 3, 4, 5 Purified Stx2B after elution with denaturing buffer (pH = 4.5). (C) Western blot analysis of rEIT (∼60 KD) and Stx2B (8 KD) using anti 6X-His-tag antibodies. Lane1: control; Lane 2: rEIT; Lane 3: rStx2 B; Lane 4: protein weight marker. (D) Western blot carried out with serum EIT and Stx2B antibodies, Lane1: mixing of rEIT and rStx2B antigens; Lane 2: protein marker; Lane3: control.
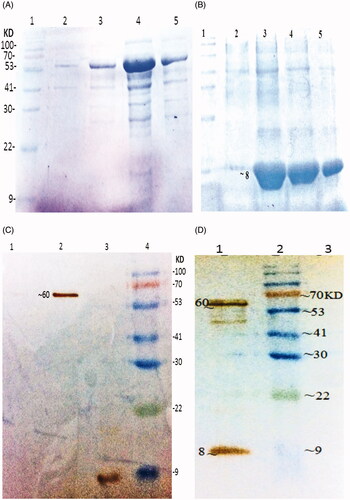
Figure 2. Measurement of physical property of nanoparticles with recombinant protein. Size distribution measured of; (A) rEIT and (B) rStx2B loaded with chitosan by Zetasizer. Zeta potential and Mobility of chitosan nanoparticles containing rEIT, (C) and rStx2B (D). Graph of in vitro antigens release of nanoparticled rEIT (E) and rStx2B (F) base on chitosan in PBS buffer.
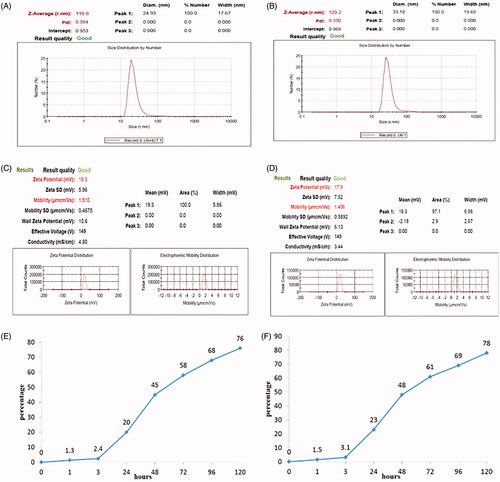
Figure 3. Results of Challenging tests in immunized and non-immunized mice against E. coli O 157:H7. (A) Reduction of shedding in immunized mice. Test and control groups were orally fed with 1010 E. coli O157:H7 and shedding was monitored daily in feces of each group for 2 weeks. Differences were considered significant whenever p < .05. (B) Number of surviving immunized and non-immunized mice infected with 150 µl of Stx2. Statistical analysis showed significant difference (p < .05) between test and control groups.
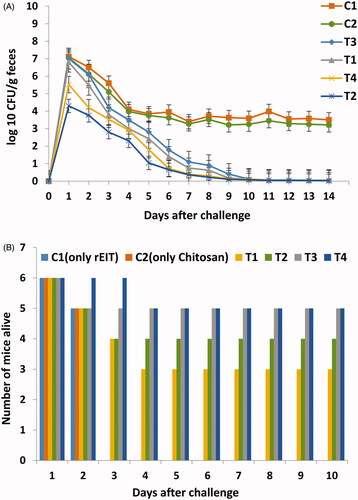
Figure 4. Comparisons of highest level of IgG (1/100) and IgA (1/5) titres against rEIT and rStx2B from immunized and control (non- immunized) groups of mice. (A) Faecal and serum IgA against EIT (B) Faecal and serum IgA against Stx2B (C) Serum IgG against rEIT of third and fourth vaccination (D) Serum IgG against rStx2B after third and fourth immunization.
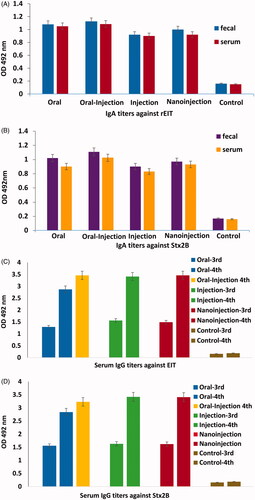
Figure 5. Light micrographs of Giemsa –stained Caco-2 cells with E. coli O157:H7 pre-treated with diferent sera (A) Negative control (only E. coli O157:H7, without pretreated by sera). (B) Non-immunized sera; (C, D, E, F) Immunized mice sera of test groups (T1, T2, T3, T4) for abbreviations see material and methods.
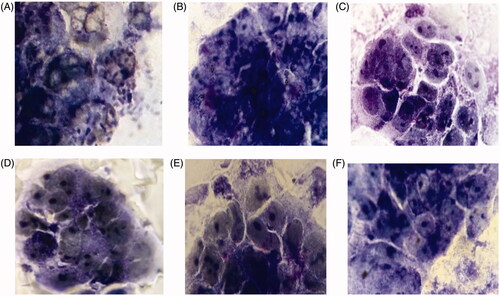
Table 2. Inhibition of E. coli O157:H7 binding to caco-2 cells.
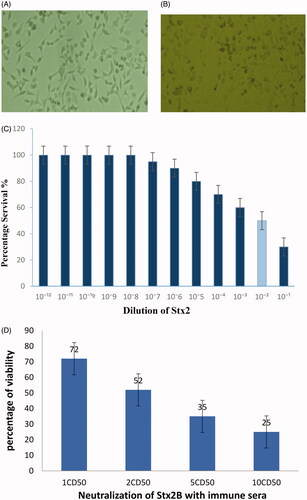
Figure 6. Effect of incubated Vero cells with Stx2 toxin. (A) Normal Vero cell control. (B) Morphological changes in Vero cells after treated with 1CD50 dilution of Stx2. Images were taken by phase contrast microscope (40×). (C) Determination of Cytotoxic dose (CD50) on Vero cells. (D) Percentage of neutralization of toxin (Stx2) with anti-sera.