Figures & data
Table 1. Immunization study design.
Figure 1. Schematic diagram of the experimental procedure. The schematic diagram represents the synthesis of N-trimethyl chitosan nanoparticles (N-TMC NPs), Bordetella pertussis antigen loading, intranasal administration, and immunization study carried out in this work.
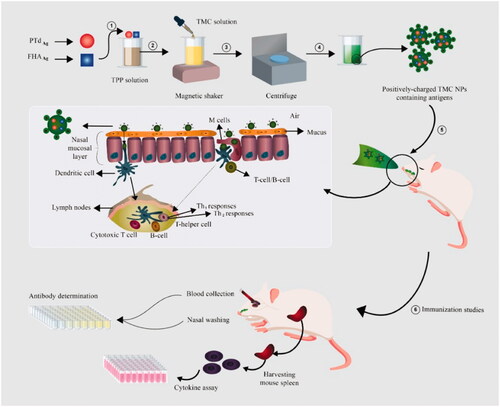
Figure 2. Transmission electron microscopy micrograph of PTd + FHA-loaded TMC NPs. PTd: pertussis toxoid; FHA: Filamentous hemagglutinin; TMC: N-trimethyl chitosan; NP: nanoparticle.
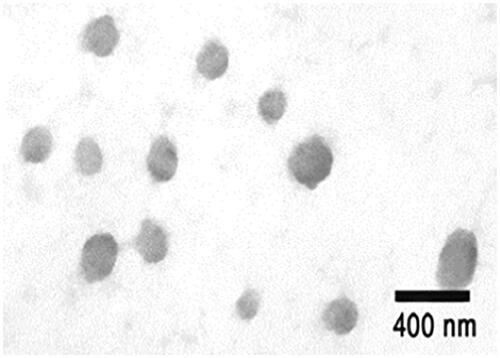
Figure 3. In vitro release profile of antigen from TMC NPs. TMC: N-trimethyl chitosan; NP: nanoparticle.
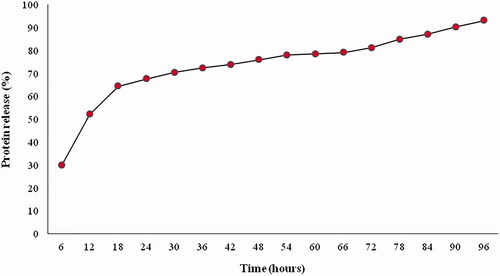
Table 2. Characterization of antigen-loaded TMC NPs.
Figure 4. (A) Total anti-PTd and anti-FHA IgG antibody titers in sera of mice in different groups. PTd: pertussis toxoid; FHA: Filamentous hemagglutinin. (B) Anti-PTd and anti-FHA secretory IgA antibody titers in nasal wash of mice in different groups.
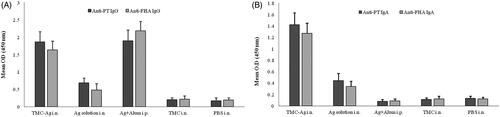
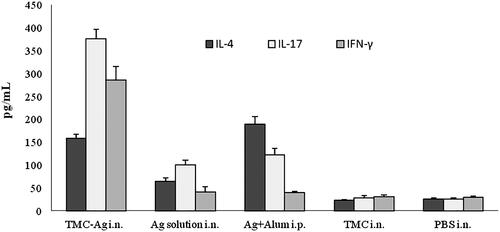
Figure 5. The levels of IL-4, IL-17 and IFN-γ release from splenocytes of immunized mice. Values represent the mean ± standard deviation of seven mice per group.