Figures & data
Table 1. Primer sequences used for RT-qPCR.
Figure 1. Immunohistochemical staining of VPS4B in postnatal mouse tooth germs. The tissue sections were counterstained with hematoxylin. (A-a) At the late bell stage (PN1), VPS4B was strongly expressed in the DP and SI and expressed less strongly in OD near the DP. (B-b) On PN2, VPS4B was expressed in both the DP and SI. (C-c) On PN5, VPS4B was consistently expressed in the DP and SI, with minimal expression in OD. (D-d) On PN7, VPS4B was highly expressed in the DP and OD. AM: ameloblasts; D: dentin; DP: dental pulp; OD: odontoblasts; POD: preodontoblasts; SR: stellate reticulum; SI: stratum intermedium.
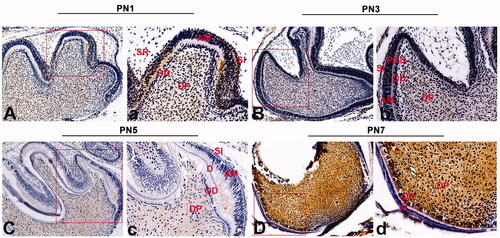
Figure 2. Analysis of the mRNA and protein expression of VPS4B and odontoblastic differentiation markers during the odontoblastic differentiation of hDPSCs. (A) Histograms showing the relative mRNA levels of DSPP, BSP, ALP and VPS4B (C) during the induction of differentiation. The mRNA levels were determined using RT-qPCR with GAPDH as a reference for normalization. (B) Representative western blots showing the protein levels of DSPP, OPN and VPS4B (D). (E) ARS staining of cells grown for 7 or 14 days in the OM. Values are mean ± SD of three independent experiments (*p < .05 and **p < .01).
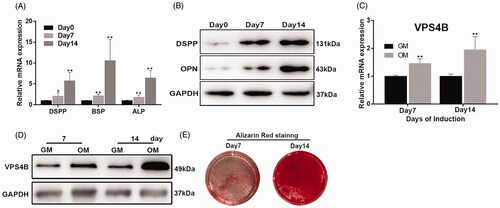
Figure 3. Stable VPS4B downregulation in hDPSCs. Passage-3 hDPSCs were infected with the indicated lentivirus at MOI of 10. (A) Representative bright-field (top) and fluorescence (bottom) microscopy images illustrating the proportion of cells expressing GFP, as an indicator of infection efficiency. (B) Histograms of the relative levels of VPS4B mRNA in transduced hDPSCs. (C) Representative western blots showing the protein level of VPS4B in hDPSCs. Scale bar = 500 μm. The data are mean ± SD of three independent experiments (***p < .001).
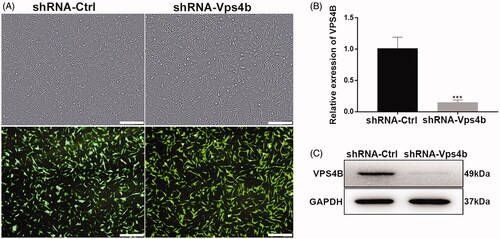
Figure 4. VPS4B downregulation inhibits the proliferation and odontoblastic differentiation of hDPSCs. Where indicated, hDPSCs were transduced with the shRNA-Ctrl or shRNA-Vps4b lentivirus. (A) Cell proliferation was monitored for 7 days using the CCK-8 assay. (B) Flow-cytometric profiles revealing the cell cycle distribution of hDPSCs transduced with the shRNA-Ctrl (left) or shRNA-Vps4b (right) lentivirus. (C) Representative western blots indicating the protein levels of VPS4B, cyclin A, and PCNA after serum starvation (S72h) and refeeding (R8h, R12h and R24h). (D) Representative western blots revealing the levels of cell cycle-related proteins cyclin A and PCNA after VPS4B downregulation. (E) Histograms showing the relative expression of DSPP, BSP, and ALP after VPS4B downregulation in hDPSCs. The mRNA levels were determined using RT-qPCR (with GAPDH as a reference for normalization) after 14 days of induction. (F) Representative western blots showing the protein levels of DSPP and OPN. (G) Representative bright-field microscopy images of ARS (top) and ALP (bottom) staining of hDPSCs at 14 and 7 days after the induction of differentiation, respectively. The data are presented as mean ± SD of three independent experiments (*p < .05 and **p < .01).
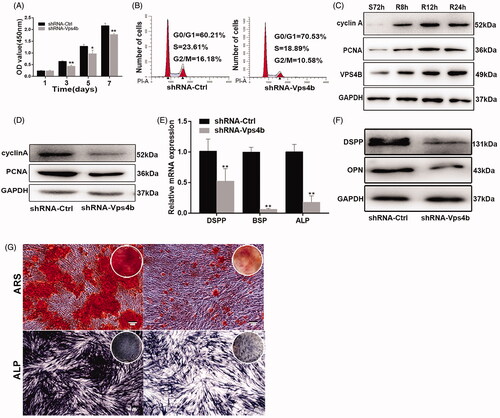
Figure 5. VPS4B downregulation inhibits the migration of hDPSCs. Representative images (A) and a boxplot illustrating the results (B) of Transwell migration assays of hDPSCs with and without VPS4B downregulation. Representative images (C) and quantification (D) of wound healing assays with and without VPS4B downregulation in hDPSCs. The values are mean ± SD of three independent experiments (*p < .05 and **p < .01).
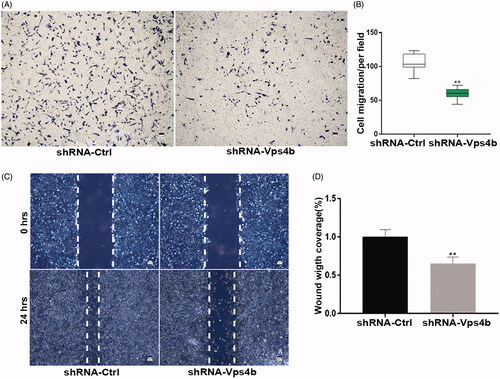
Figure 6. By acting via the Wnt-β-catenin pathway, VPS4B regulates the dentinogenesis driven by hDPSCs. Where indicated, hDPSCs were transduced with the shRNA-Ctrl or shRNA-Vps4b lentivirus and cultured in the presence of 10 mM LiCl. (A) Representative western blots showing the total, cytoplasmic, and nuclear protein levels of β-catenin after VPS4B downregulation in hDPSCs grown in the GM or OM for 14 days. GAPDH served as a loading control for total and cytoplasmic proteins, while histone H3.1 was employed as a loading control for nuclear proteins. (B) Representative western blots showing the relative protein levels of β-catenin after induction of the odontogenic differentiation of hDPSCs.
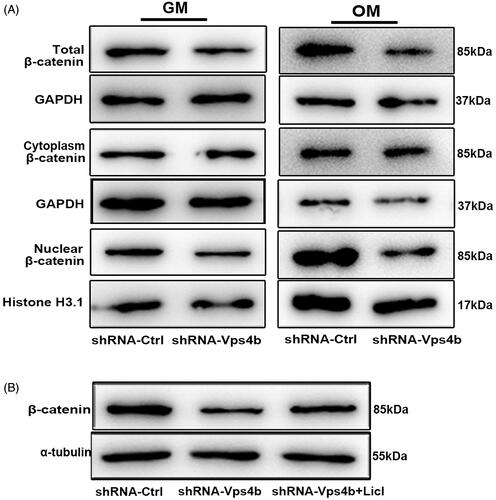
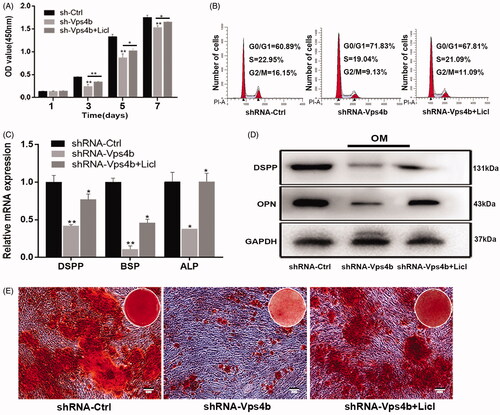
Figure 7. LiCl partially reverses the inhibitory effects of the VPS4B knockdown on hDPSCs proliferation and odontogenic differentiation by stimulating the Wnt-β-catenin signalling pathway. Where indicated, hDPSCs were transduced with the shRNA-Ctrl or shRNA-Vps4b lentivirus and were cultured in the presence of 10 mM LiCl. (A) Cell proliferation was monitored for 7 days using the CCK-8 assay. (B) Flow-cytometric profiles of the cell cycle distribution. (C) A histogram of the relative expression of DSPP, BSP and ALP in hDPSCs grown in the OM. (D) Representative western blots depicting the relative protein levels of DSPP and OPN after induction of the odontogenic differentiation of hDPSCs. (E) Representative bright-field microscopy images of ARS staining of hDPSCs cultured in the OM for 14 days. The data are presented as mean ± SD of three independent experiments (*p < .05 and **p < .01).