Figures & data
Table 1. The forward and reverse primers of caspase-9, caspase-3, Bax, Bcl-2 and Bid.
Figure 1. Synthesis and UV–visible spectrum absorption pattern of gold nanoparticles synthesized from C. militaris. (A) Represents that the C. militaris extract alone (pale yellow colour) and Gold nanoparticles with C. militaris extract (deep brown colour). (B) Represents that the gold nanoparticles with C. militaris extract develop the peak value at 540 nm.
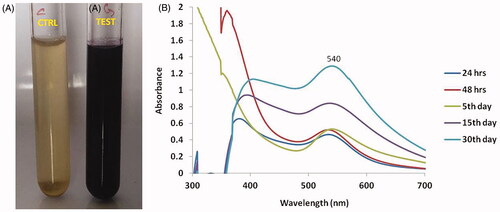
Figure 2. HR-transmission electron microscopy image and energy dispersive X-ray analysis of gold nanoparticles synthesized from C. militaris. (A) The size of the AuNPs was 15–25 nm. (B) The shape of the AuNPs with C. militaris was face-centre-cubic structure.
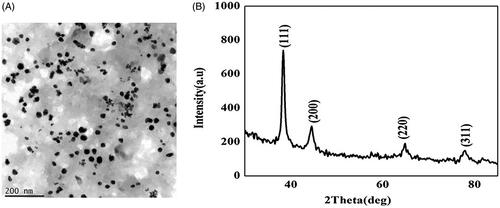
Figure 3. FT-IR analysis of gold nanoparticles synthesized from C. militaris. The functional group such as hydroxyl and alkynes were determined in the AuNPs C. militaris.
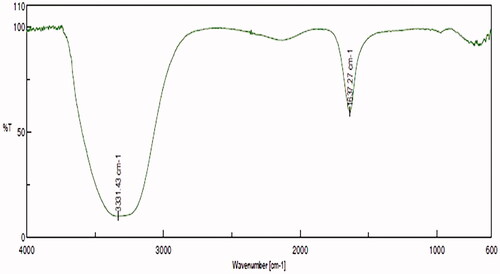
Figure 4. The cytotoxicity of gold nanoparticles synthesized from C. militaris was determined in HepG2 cells by MTT. (A) 50% cell viability of the HepG2 cells were observed in the 10 and 12.5 µg/ml concentration treated with AuNPs C. militaris. (B) Morphological analysis of AuNPs C. militaris treated HepG2 cells.
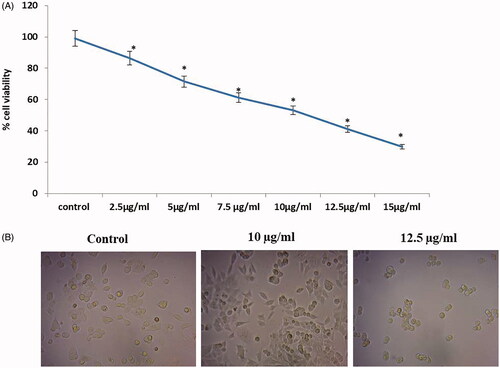
Figure 5. Effect of gold nanoparticles from C. militaris induces apoptotic morphological changes in HepG2 cells. The untreated cells showed the absence of apoptosis by observing green fluorescence staining. 10 µg and 12.5 µg/ml illustrates that the gold nanoparticles treatment significantly increased the apoptotic cells by observing orange fluorescence staining in HepG2 cells.
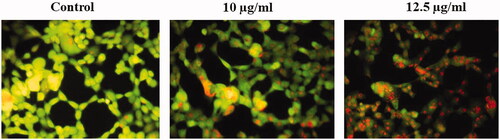
Figure 6. Represents that the mitochondrial membrane permeability was determined in untreated and treated HepG2 cells with AuNPs. The mitochondrial membrane permeability was stable (strong fluorescence) in untreated HepG2 cells. The mitochondrial membrane permeability was damaged (weak fluorescence) in HepG2 cells treated with 10 µg/ml AuNPs. 10 µg/ml AuNPs represents that the mitochondrial membrane permeability was damaged more (weaker fluorescence) in HepG2 cells.
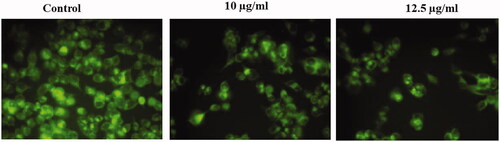
Figure 7. Represents the status of the ROS in untreated and treated HepG2 cells with AuNPs C. militaris. The ROS induction was not observed in the untreated cells. The mild ROS induction was observed in HepG2 cells treated with 10 µg/ml AuNPs. The strong ROS induction was observed in HepG2 cells treated with 12.5 µg/ml AuNPs.
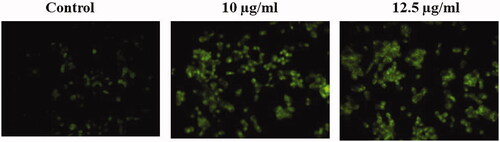
Figure 8. The enzymatic activities of caspases were determined in untreated and treated HepG2 cells with AuNPs C. militaris. (A) Represents that the caspase 3 was increased in the AuNPs treated cells when compared with untreated HepG2 cells. (B) Represents that the caspase 8 was increased in the AuNPs treated cells when compared with untreated HepG2 cells. (C) Represents that the caspase 9 was increased in the AuNPs treated cells when compared with untreated HepG2 cells.
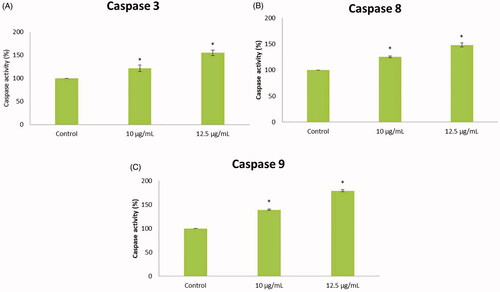
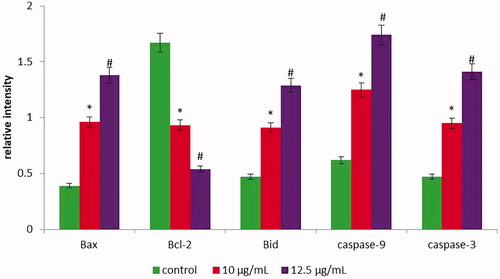
Figure 9. The gene expression of caspase-9, caspase-3, Bax, Bcl-2 and Bid were determined in untreated and treated HepG2 cells with AuNPs C. militaris using q-PCR. The AuNPs (10 µg/ml) treatment significantly (*p ≤ .05) increased the mRNA expression of caspase-3, caspase-9, Bax, Bid and decreased the m-RNA expression of Bcl-2 in HepG2 cells, when compared to untreated cells. The AuNPs (12.5 µg/ml) treatment significantly (#p ≤ .01) increased the mRNA expression of caspase-3, caspase-9, Bax, Bid and decreased the m-RNA expression of Bcl-2 in HepG2 cells. Values were expressed as mean ± SD.