Figures & data
Figure 1. LncRNA SNHG6 is highly expressed in nephroblastoma. The level of LncRNA SNHG6 in clinical human nephroblastoma tissues and the corresponding regular tissues was firstly detected via qRT-PCR. ***p < .001 compared with normal tissues group.
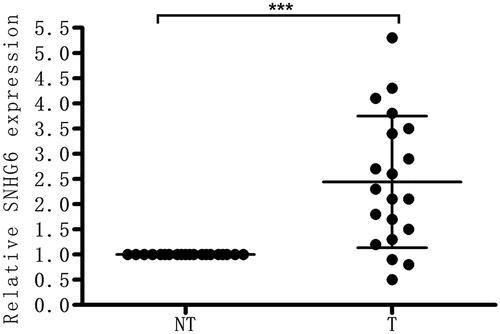
Figure 2. Si-SNHG6 suppressed cell proliferation and induced cell apoptosis. G401 and SK-NEP-1 cells were transfected with si-NC or si-SNHG6 or left untreated as the control, respectively. (A) SNHG6 expression was tested through qRT-PCR. (B) Cell proliferation was detected using bromodeoxyuridine as described. (C) Cell viability was valued through CCK8 assay. (D, E) Levels of cell proliferation related proteins in G401 cells were tested through western blot. (F, G) Levels of cell proliferation related proteins in SK-NEP-1 cells were tested via western blot. (H, I) Levels of apoptosis related proteins in G401 cells were tested via western blot. (J, K) Levels of apoptosis related proteins in SK-NEP-1 cells were tested via western blot. (I) Apoptosis was tested via flow cytometry. *p < .05, **p < .01, ***p < .001 contrasted with CTRL set.
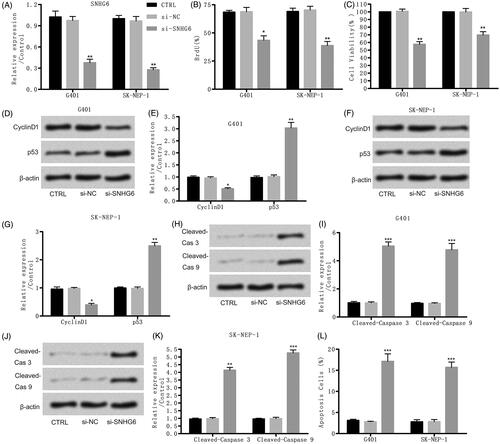
Figure 3. Si-SNHG6 suppressed cell migration and invasion. G401 and SK-NEP-1 cells were transfected with si-NC or si-SNHG6 or left untreated as the control, respectively. (A) The effect of SNHG6 knockdown on cell migration was tested via wound-healing experiment. (B) Invasive number of SNHG6-downregulated both cells was detected via transwell invasion assays. **p < .01 contrasted with CTRL set.
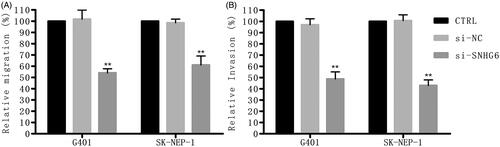
Figure 4. Si-SNHG6 up-regulates the level of miR-15a. G401 and SK-NEP-1 cells were transfected with si-NC or si-SNHG6 or left untreated as the control, respectively. The level of miR-15a was tested through qRT-PCR. **p < .01 contrasted with CTRL set.
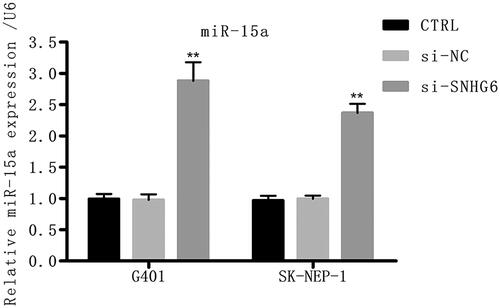
Figure 5. Si-SNHG6 suppressed cell proliferation and caused apoptosis via positively regulating miR-15a. G401 and SK-NEP-1 cells were transfected with si-NC + NC inhibitor or si-SNHG6 + NC inhibitor or si-SNHG6 + miR-15a inhibitor or left untreated as the control, respectively. (A) miR-15a expression was tested through qRT-PCR. (B) Cell proliferation was detected using bromodeoxyuridine as described. (C) Cell viability was valued through CCK8 assay. (D, E) Levels of cell proliferation related proteins in G401 cells were tested via western blot. (F, G) Levels of cell proliferation related proteins in SK-NEP-1 cells were tested via western blot. (H) Apoptosis was tested via flow cytometry. (I, J) Levels of apoptosis related proteins in G401 cells were tested via western blot. (K, L) Levels of apoptosis related proteins in SK-NEP-1 cells were tested via western blot. **p < .01, ***p < .001 contrasted with CTRL set. #p < .05 contrasted with si-SNHG6 + NC inhibitor group.
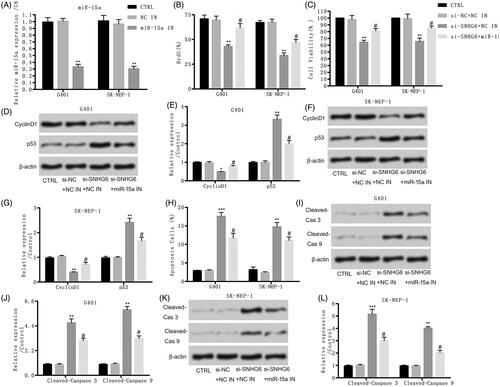
Figure 6. Si-SNHG6 suppressed cell migration and incursion via up-regulating miR-15a. G401 and SK-NEP-1 cells were transfected with si-NC + NC inhibitor or si-SNHG6 + NC inhibitor or si-SNHG6 + miR-15a inhibitor or left untreated as the control, respectively. (A) The effect of SNHG6 knockdown on cell migration was tested via wound-healing experiment. (B) Invasive number of SNHG6-downregulated in both cells was detected through transwell invasion assays. **p < .01 contrasted with CTRL set. #p < .05 contrasted with si-SNHG6 + NC inhibitor group.
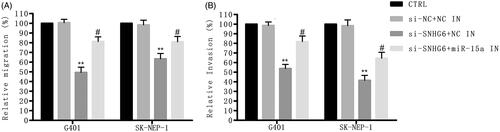
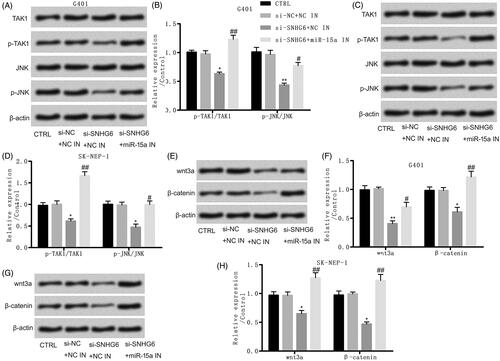
Figure 7. Si-SNHG6 suppressed TAK1/JNK and Wnt/β-catenin signal pathways via positively regulating miR-15a. G401 and SK-NEP-1 cells were transfected with si-NC + NC inhibitor or si-SNHG6 + NC inhibitor or si-SNHG6 + miR-15a inhibitor or left untreated as the control, respectively. (A, B) Levels of TAK1/JNK signal pathway associated proteins in G401 cells were tested through western blot. (C, D) Levels of TAK1/JNK signal pathway associated proteins in SK-NEP-1 cells were tested through western blot. (E, F) Levels of Wnt/β-catenin signal pathway associated proteins in G401 cells were detected through western blot. (G, H) Levels of Wnt/β-catenin signal pathway associated proteins in SK-NEP-1 cells were tested through western blot. β-Actin was a reference. *p < .05, **p < .01 contrasted with CTRL set. #p < .05, ##p < .01 contrasted with si-SNHG6 + NC inhibitor set.