Figures & data
Figure 1. Hypoxia triggered apoptosis and autophagy in PC-12 cells. After administration with hypoxia for 12 h, CCK-8 and flow cytometry were executed for (A) cell viability and (B) cell apoptosis determination. Western blot assay was carried out for (C and D) Bax, pro/cleaved-Cleaved-3, PARP and cleaved-PARP and (E and F) Beclin-1, p62 and LC3-I/LC3-II protein levels assessment. The three independent experiments were conducted. *p < .05, **p < .01 and * **p < .001.
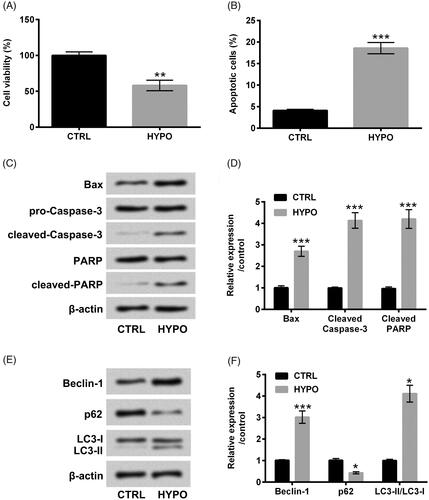
Figure 2. EMO lightened hypoxia-triggered apoptosis and autophagy in PC-12 cells. (A) PC-12 cells were disposed with diverse concentrations of EMO (0, 5, 10, 15 and 20 μM) for 12 h, CCK-8 was implemented for cell cytotoxicity determination. After hypoxia administration and EMO treatment, CCK-8 and flow cytometry were performed for (B) cell viability and (C) cell apoptosis assessment. Western blot assay was implemented for (D and E) Bax, pro/cleaved-Cleaved-3, PARP and cleaved-PARP and (F and G) Beclin-1, p62 and LC3-I/LC3-II protein levels determination. The three independent experiments were conducted. **p < .01 and ***p < .001: HYPO group versus CTRL group; ##p < .01, ###p < .001: HYPO + EMO group versus HYPO group; ns: no significant difference.
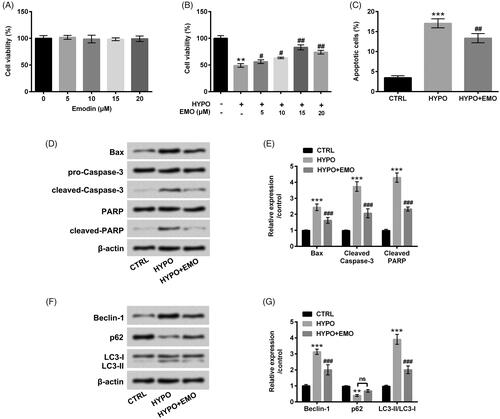
Figure 3. EMO elevated miR-25 expression under hypoxia administration. After hypoxia and EMO (15 μM) disposition, RT-qPCR essay was carried out for miR-25 expression determination in PC-12 cells. The three independent experiments were conducted. **p < .01: HYPO group versus CTRL group; #p < .05: HYPO + EMO group versus HYPO group.
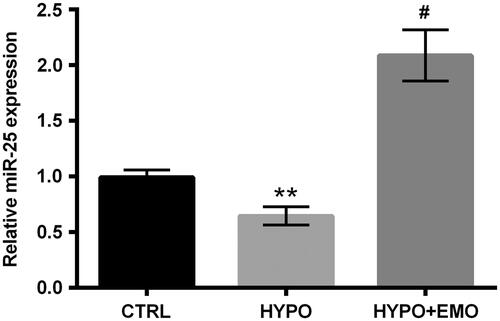
Figure 4. Suppressed miR-25 overturned the impacts of EMO on apoptosis and autophagy in hypoxia-disposed PC-12 cells. (A) After miR-25 inhibitor and its correlative control transfections, RT-qPCR essay was implemented for miR-25 expression detection. PC-12 cells were then co-disposed with hypoxia and EMO, meanwhile transfected with miR-25 inhibitor, CCK-8 and flow cytometry were implemented for (B) cell viability and (C) cell apoptosis detection. Western blot assay was executed for (D and E) Bax, pro/cleaved-Cleaved-3, PARP and cleaved-PARP and (F and G) Beclin-1, p62 and LC3-I/LC3-II protein levels assessment. The three independent experiments were conducted. *p < .05, **p < .01 and ***p < .001: HYPO group versus CTRL group or HYPO + EMO + miR-25 inhibitor versus HYPO + EMO + NC inhibitor; ###p < .001: HYPO + EMO group versus HYPO group; ns: no significant difference.
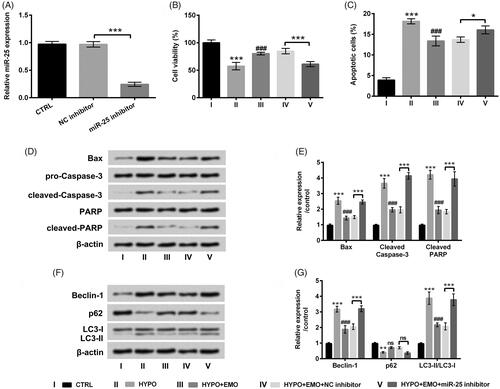
Figure 5. NEFL was a neoteric target gene of miR-25. (A) PC-12 cells were administrated with hypoxia and EMO, simultaneously transfected with miR-25 inhibitor, Western blot and RT-qPCR were executed for assessment of the protein and mRNA levels of NEFL. (B) Dual luciferase report essay was carried out for confirmation of the relevancy between miR-25 and NEFL. The three independent experiments were conducted. *p < .05 and ***p < .001: HYPO group versus CTRL group or HYPO + EMO + miR-25 inhibitor versus HYPO + EMO + NC inhibitor or miR-25 mimic + NEFL-wt versus NC mimic + NEFL-wt; #p < .05: HYPO + EMO group versus HYPO group.
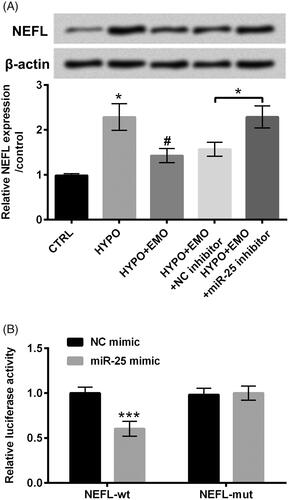
Figure 6. Overexpressed NEFL ameliorated the functions of EMO in apoptosis and autophagy in hypoxia-disposed PC-12 cells. (A) PC-12 cells were transfected with pc-NEFL and pcDNA3.1 vectors, RT-qPCR essay was implemented for NEFL expression determination in PC-12 cells. After co-disposition with hypoxia and EMO and transfection with pc-NEFL, flow cytomentry was carried out for (B) cell apoptosis assessment. Western blot assay was executed for (C and D) Bax, pro/cleaved-Cleaved-3, PARP and cleaved-PARP and (E and F) Beclin-1, p62 and LC3-I/LC3-II protein levels determination. The three independent experiments were conducted. *p < .05, **p < .01 and ***p < .001: pc-NEFL group versus pcDNA3.1 group, HYPO group versus CTRL group or HYPO + EMO + pc-NEFL versus HYPO + EMO + pcDNA3.1; #p < .05, ###p < .001: HYPO + EMO group versus HYPO group; ns: no significant difference.
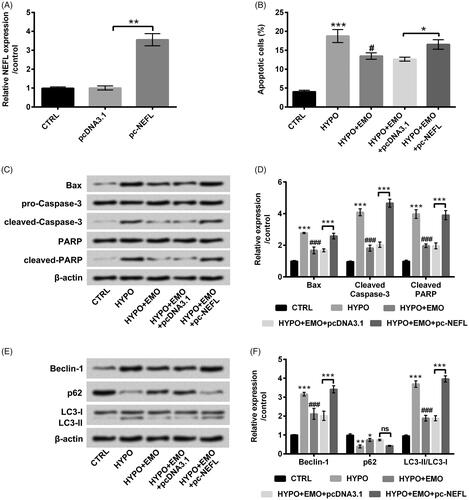
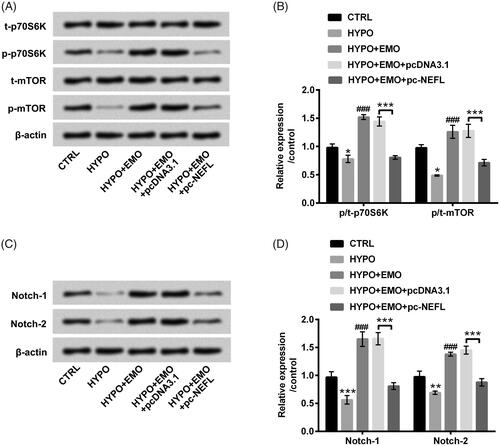
Figure 7. EMO activated mTOR and Notch pathways via hindering NEFL expression in hypoxia-disposed PC-12 cells. After co-disposition with hypoxia and EMO and transfection with pc-NEFL, Western blot essay was carried out for (A and B) p/t-p70S6K and p/t-mTOR, as well as (C and D) Notch-1 and Notch-2 protein levels determination. The three independent experiments were conducted. *p < .05, **p < .01 and ***p < .001: HYPO group versus CTRL group or HYPO + EMO + pc-NEFL versus HYPO + EMO + pcDNA3.1; ###p < .001: HYPO + EMO group versus HYPO group.