Figures & data
Figure 1. The overall levels of 5mC/5hmC in CSCC. The dot plot (A) and IHC staining (C) with the corresponding statistical analysis (B, D) of 5mC in CSCC. The dot plot (E) and IHC staining (G) with the corresponding statistical analysis (F, H) of 5hmC in CSCC. Experiments were performed in triplicates. “*” represents the comparison between I-IIa group of CSCC and cervicitis with p values less than 0.05. “#” represents the comparison between IIb and IV group of cervicitis and control with p values less than .05.
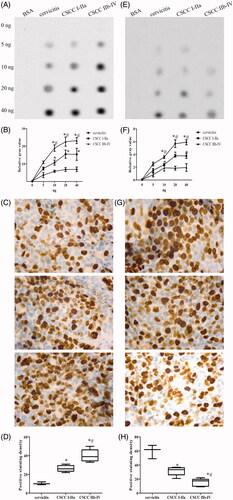
Figure 2. The genomic distribution of 5mC/5hmC in CSCC. The MA plot of IIb–IV group of CSCC and cervicitis contrast of 5mC (A) and 5hmC (B) peaks normalized with tag density. The X axis indicates the normalized mean and the Y axis indicates the log2-fold change. The red pixels mean the differential peaks with FDR less than 0.05. The blue pixels mean the peaks with no significant difference. The genome-wide mapping of 5mC (C) and 5hmC (D) in cervicitis and different stages of CSCC. Normalized DMRs and DHMRs tag density distribution across the gene body. Each gene body was normalized to 0–100%. Normalized Tag density is plotted from 20% of upstream of transcription start sites (TSS) and 20% of downstream of transcription terminal sites (TTS). -3 kb to TSS and +3 kb to TTS is shown.
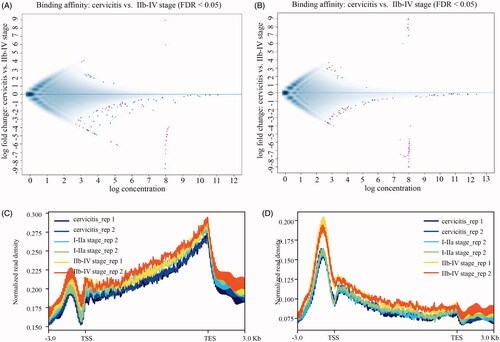
Table 1. The summary of MeDIP and hMeDIP-seq data.
Figure 3. The associated functions of DMR/DHMRs in CSCC. The count of selected DMRs/DHMRs with the similar or opposite variation trend of 5mC/5hmC compared among cervicitis, I–IIa and IIb–IV of CSCC (A). Upper and down arrow mean the up- and down-regulated 5mC compared among cervicitis, I–IIa and IIb–IV of CSCC. Left and right arrow mean the up- and down-regulated 5hmC compared among cervicitis, I–IIa and IIb–IV of CSCC. “-” means no variation of 5mC/5hmC among these three groups. The distribution of the selected DMRs/DHMRs in genomic regions (B). GO (C) and KEGG (D) analysis of the genes associated with DMRs/DHMRs.
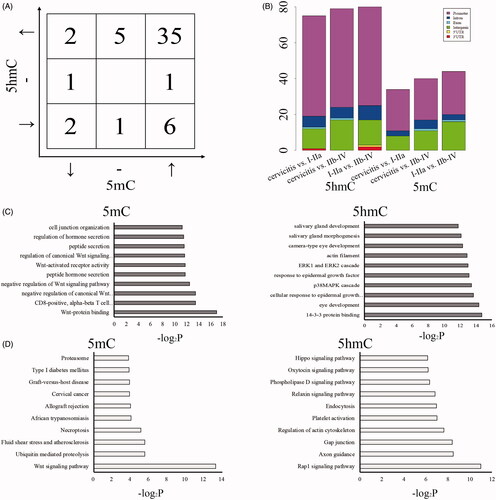
Table 2. The annotation of RefSeq genes associated with DMRs/DHMRs.
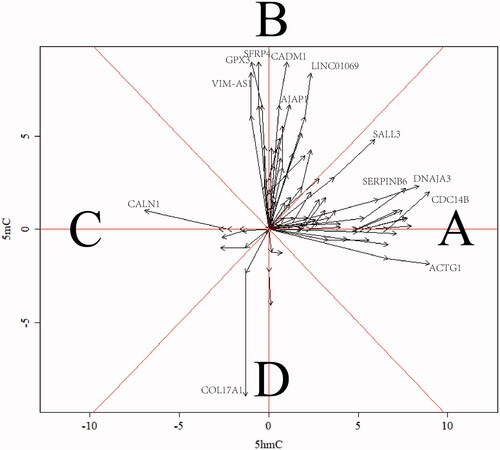
Figure 4. Vector picture for clarification of the sensitivity of variation trend of 5mC/5hmC. The area of A and C mean the associated genes with 5hmC sensitive change while area B and D mean the associated genes with 5mC sensitive change in the malignancy of CSCC. The X/Y axis indicates the normalized log2-fold change of 5mC/5hmC.