Figures & data
Table 1. Primer sequences used for qRT-PCR.
Table 2. Sequences of AKT3-siRNAs.
Figure 1. The inhibition rates of continuously variable concentrations of cisplatin on Hela and Hela/DDP. CCK-8 Assay was performed to do cytotoxicity test. Cell viability analyzed by measuring absorbance at 450 nm using a microplate reader. Data represent the mean ± SD of three individual experiments.
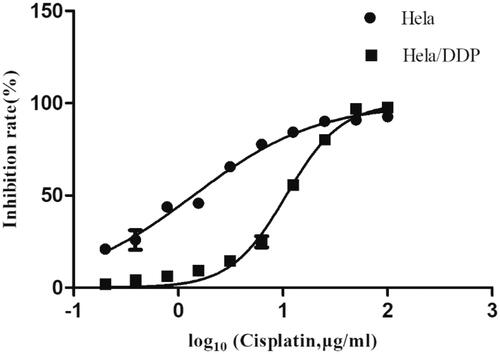
Figure 2. Volcano graphs of all DEG enrichment. Each point in the volcano diagram represents one differentially expressed gene, and the x-axis represents the log 2 (fold change) and the y-axis shows the –log 10 (1 − P). The greater the absolute value of the horizontal coordinate, the greater the difference between the two samples. The larger the ordinate value, the differential expression is more significant, and the differentially expressed gene is more reliable. In the green dots, the differentially expressed gene is down-regulated, and the red dots represent the differentially expressed genes. The black dots represent the non-differentially expressed genes.
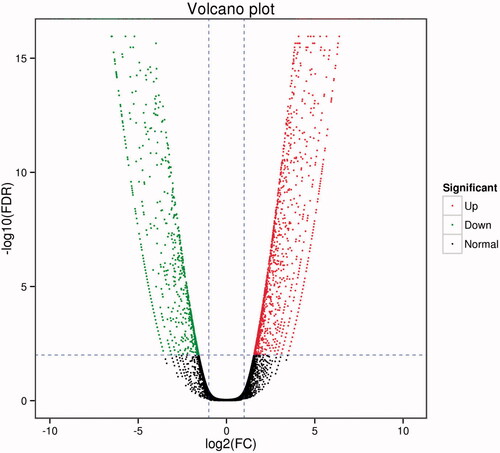
Table 3. Summary of sequencing data.
Table 4. Summary of comparative analysis.
Figure 3. Functional classification of gene ontology (GO) database on DEGs. The x-axis is the GO classification, the left of the y-axis is the percentage of the number of genes, and the right is the number of DEGs and all genes.
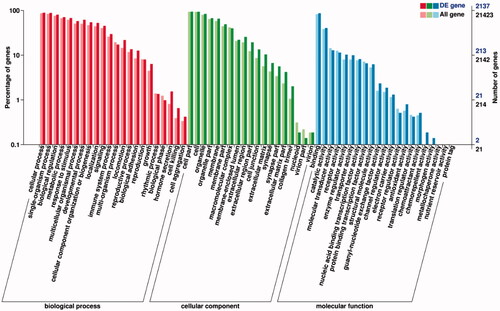
Figure 4. Functional classification of Cluster of Orthologous Groups of proteins (COG) database on DEGs. The x-axis shows the contents of COG, and the ordinate is the frequency of genes. Different functional classes reflect the corresponding period of genes and metabolism or physiological of environment.
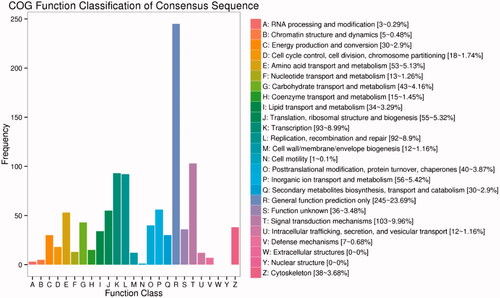
Figure 5. Kyoto Encyclopaedia of Genes and Genomes (KEGG) database categorized DEGs. (A) KEGG functional annotation on DEGs. The x-axis represents the number of genes annotated to the pathway and the proportion of all genes. The y-axis shows the name of KEGG metabolic pathway. (B) Scatter plot of KEGG pathway enrichment. Each circle point represents a KEGG pathway. The ordinate is log10 (Q value), Q value is the p value after multiple hypothesis tests. Thus, the bigger the enrichment factor, the more significant the enrichment level of DEGs in the pathway. (C) Pathway map of PI3K/AKT. The PI3K-AKT signalling pathway is annotated with most DEGs among all the referred pathways.
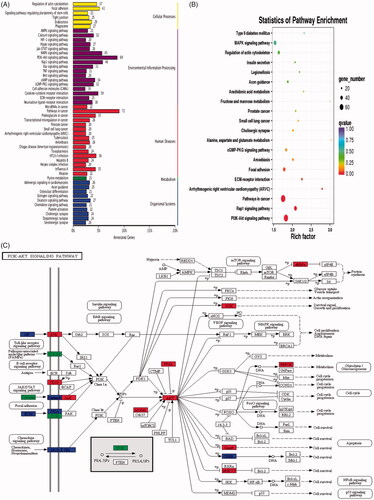
Table 5. Information of test genes from DEGs.
Figure 6. Differentially expressed genes revealed by deep sequencing validated using quantitative real-time reverse transcription PCR (qRT-PCR). Comparison of the relative expressions obtained using two platforms showed quite correspondence for most pairs. The left columns of every double bars represent the log 2 ratio fold change in each DEG with the application of next-generation sequencing (NGS) and right columns represent log 2 fold changes using qRT-PCR.
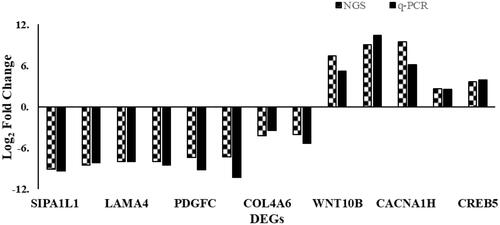
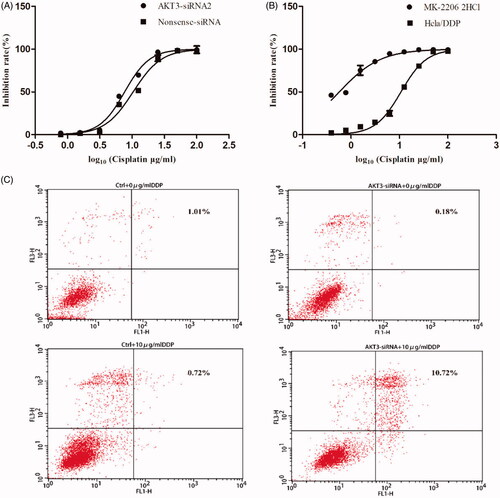
Figure 7. mRNA and protein level alteration after treating with AKT3-siRNA or inhibitor. (A) qRT-PCR was performed for AKT3. The expression level of it was normalized to the level in Hela cells. Hela/DDP cells were treated with AKT3-siRNA, Nonsense-siRNA or MK-2206, and harvested after 24 h of transfection. (B) The effect of AKT3-siRNA on the levels of AKT3 mRNA expressions in Hela/DDP cells. (C) Immunoblot depicting Akt3 and pAkt protein levels.
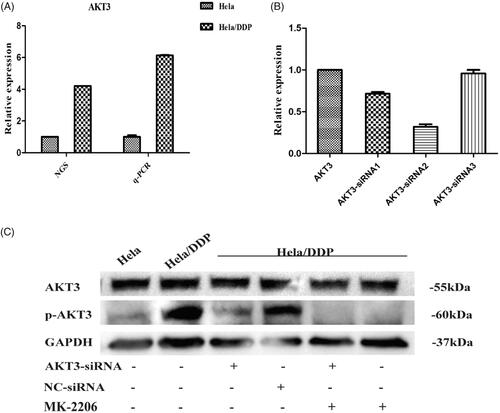
Figure 8. Knockdown AKT3 in Hela/DDP cells increased its sensitivity to cisplatin and apoptotic rate. (A) CCK-8 assay showed that after treating with AKT3-siRNA Hela/DDP’s sensitive to cisplatin changed slightly. (B) CCK-8 assay was performed to examine cell survival. After treating with MK-2206 for 24 h, Hela/DDP cells showed more sensitive to cisplatin. (C) Apoptotic rate of Hela/DDP cells was measured through using Annexin-V/PI staining on a flow cytometry.