
Figures & data
Figure 1. Microscopic images of prepared (a) PA (SEM), (b and b1) rGO (SEM) and (c, c1 and c2) HAp loaded nano-GO/PA (SEM) samples.
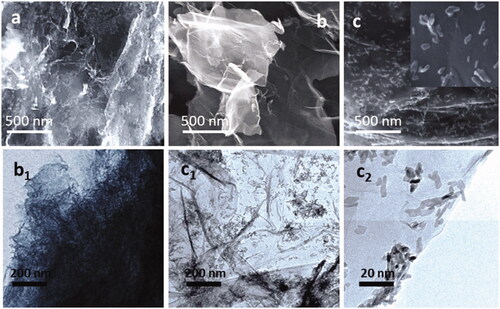
Figure 2. Spectroscopic analysis of prepared nanocomposited materials through different analytical methods (a) XRD, (b) Raman spectra and (c) FTIR spectral analysis.
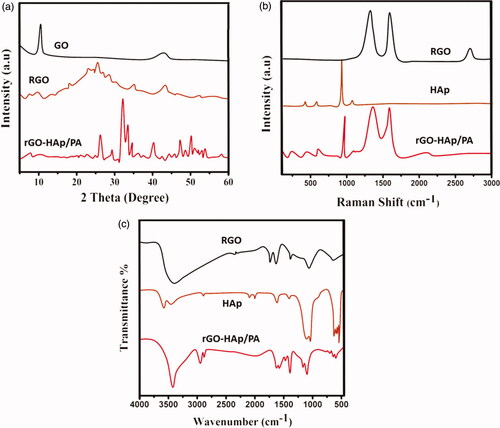
Figure 3. Live/dead assay method to investigate cell compatibility and survival of the fibroblast cell line treated with prepared nanocomposite (scale bar = 50 µm) (A) Fluorescence microscopic images (B) MTT assay showing cell viability.
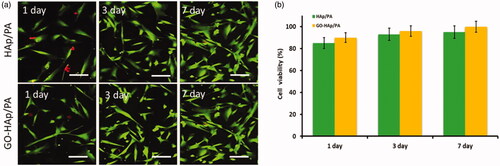
Figure 4. (a) Postoperative lateral radiograph image, (b) lateral radiograph image after one year and (c) lateral radiograph image after 2 years.
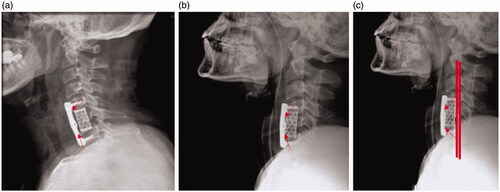
Table 1. Patient demographic details.
Table 2. Clinical and radiographic outcomes.