
Figures & data
Table 1. Basic and clinical features of the study subjects.
Table 2. Association of HCN4 polymorphisms with AF risk.
Figure 1. The distributions of HCN4 rs498005 (A) and rs7164883 (B) polymorphisms in AF cases and controls. *p < .05.
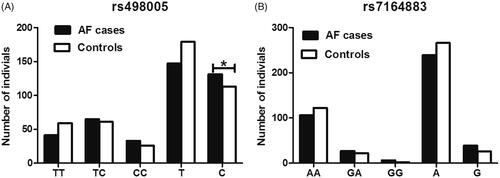
Figure 2. Association of rs498005 genotypes with clinical parameters of AF patients. *: CC versus TT p < .01; **: CC versus TT p < .001; #: CC versus TC p < .05; ##: CC versus TC p < .001.
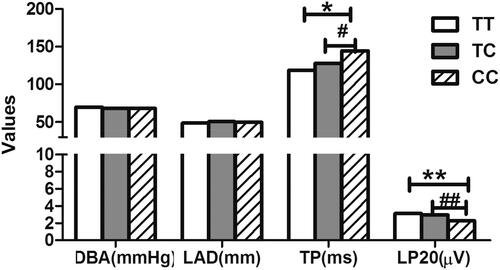
Table 3. Impacts of rs498005 genotypes for AF clinical features in AF patients.