Figures & data
Figure 1. H1.5T10ph is negatively regulated by Ras-AKT activation. The plasmids for expression of wide-type of Ras (RasWT) or RasG12V/Y40C were transfected into A172 cells. The empty pEGFP plasmid was transfected as a blank control. Protein expression levels of (A) p-AKT, AKT and (B) H1.5T10ph, H1.5 were measured by Western blot. (C) Semiquantitative analysis of H1.5T10ph expression. *p < .05.
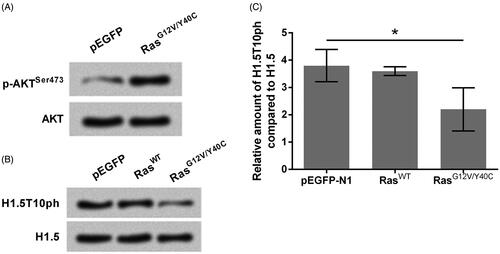
Figure 2. H1.5T10ph inhibits Ras-AKT activation induced growth and migration of A172 cells. The plasmids for expression of H1.5 (GFP-H1.5) and RasG12V/Y40C were transfected into A172 cells. H1.5T10E, a plasmid for expressing mimicked H1.5T10ph, was transfected instead of GFP-H1.5 in the indicated group. (A) Cell viability was tested and OD-values were recorded in MTT assay. Increasing amount of H1.5T10E (0.5, 1, and 2 μg) was used in this procedure. (B) Number of colony and (C) migration were measured by soft-agar colony formation and transwell assays. Two micrograms of H1.5T10E was utilized in these two assays. *p < .05, **p < .01, ***p < .001.
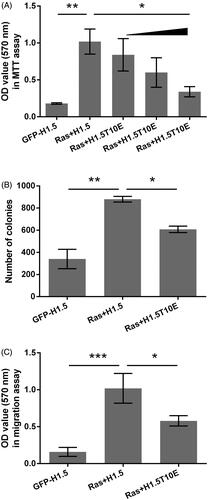
Figure 3. H1.5T10ph regulates the transcription of Ras downstream genes. (A) A172 cells were transfected with plasmids for expression of RasG12V/Y40C, H1.5 or mimicked H1.5T10ph (H1.5T10E). mRNA levels of Ras downstream genes were determined by qRT-PCR. (B) A172 cells were transfected with plasmids for expression of RasG12V/Y40C and H1.5. ChIP assay was carried out to detect the enrichment of H1.5T10ph in the promoter of these genes. *p < .05, **p < .01, ***p < .001.
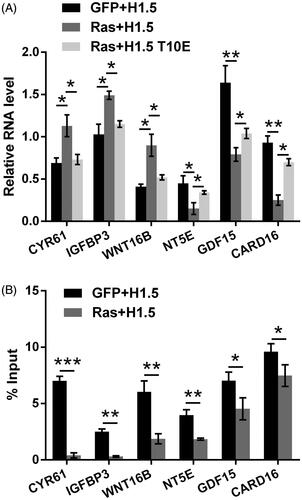
Figure 4. GSK3 overexpression up-regulates H1.5T10ph and reverses Ras-AKT activation induced tumor cells growth and migration. (A) GSK3 expression plasmid (GSK3-HA) was transfected into A172 cells, and transfection efficiency was tested by qRT-PCR. Results were shown in gel electrophoresis. (B) A172 cells were co-transfected with plasmids for expression of RasG12V/Y40C and GSK3. The expression of H1.5T10ph was measured by Western blot. (C) Cell viability, (D) migration, and (E) cell-cycle progression were respectively assessed by MTT assay, soft-agar colony formation assay and flow cytometry. GSK3-HA plasmid was used with concentrations of 0.5 and 1 μg in these assays. *p < .05, **p < .01.
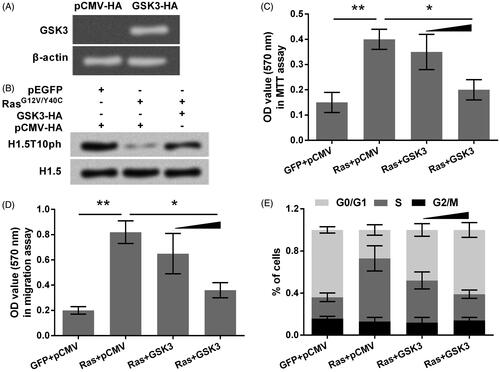
Figure 5. Ras-AKT signaling represses H1.5T10ph expression through degradation of GSK3. (A) The plasmid for expression of RasG12V/Y40C was transfected into A172 cells. The mRNA level of GSK3 was tested by qRT-PCR and the data was shown in gel electrophoresis. (B) A172 cells were co-transfected with plasmids for expression of GSK3 and RasG12V/Y40C. Exogenous levels of GSK3 protein was tested by Western blot. (C) Plasmid for expressing RasG12V/Y40C was transfected and then the endogenous levels of GSK3 protein was tested by Western blot. (D) The enrichment of GSK3 in the promoter of Ras downstream genes was tested by ChIP. (E) MG132, a protease inhibitor, was used to treat A172 cells. The expression of GSK3 was tested by Western blot. (F) RasG12V/Y40C expression plasmid was transfected into A172 cells. The expression of H1.5T10ph was monitored following transfection of 0–60 h. (G) After 48 h of transfection, A172 cells were treated by MG132 for 0–12 h. The expression of H1.5T10ph was reassessed. *p < .05, **p < .01, ***p < .001.
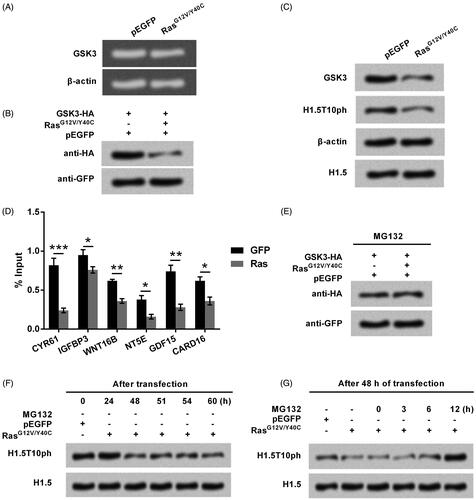
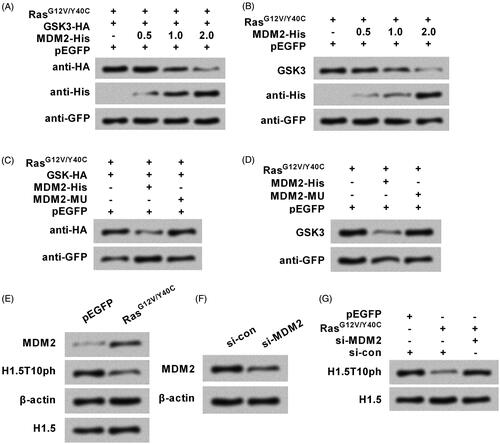
Figure 6. Ras-AKT signaling degrades GSK3 through modulation of MDM2. (A) The plasmids for expression of RasG12V/Y40C, GSK3, and MDM2 were transfected into A172 cells. His-tagged MDM2 plasmid (MDM2-His) was used with concentrations of 0.5, 1, and 2 μg. Exogenous levels of GSK3 protein were tested by Western blot. (B) The plasmids for expression of RasG12V/Y40C and MDM2 were transfected. Endogenous levels of GSK3 protein were reassessed. A plasmid for expression of mutated type of MDM2 (MDM2-MU) was transfected instead of the MDM2-His. (C) Exogenous and (D) endogenous levels of GSK3 protein were respectively tested. (E) RasG12V/Y40C expression plasmid was transfected into A172 cells, and then the protein levels of MDM2 and H1.5T10ph were measured. (F) siRNA specific for MDM2 (si-MDM2) was transfected into cell. Transfection efficiency was tested by Western blot. (G) RasG12V/Y40C expression plasmid and si-MDM2 were co-transfected into cell. The expression of H1.5T10ph was measured.