
Figures & data
Figure 1. Relative expression of X91348 in tissues samples. X91348 expression level was significantly lower in HCC tissues than in adjacent non-cancerous tissues (p< .05).
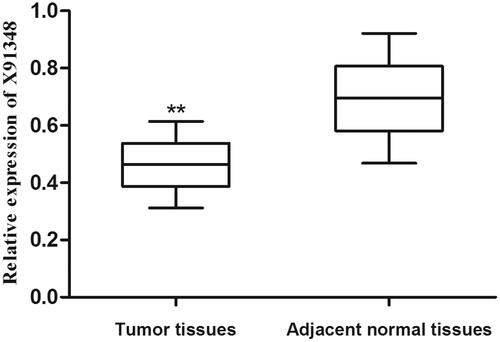
Figure 2. Relative expression of X91348 in serum samples. Serum X91348 expression level was significantly decreased in patients with HCC compared with healthy controls (p< .05).
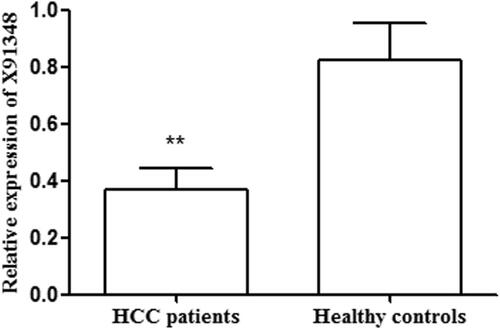
Table 1. The relationship between clinicopathologic characteristics and X91348 expression.
Figure 3. ROC curve estimating diagnostic value of X91348 expression. The AUC reached 0.807 while the sensitivity and specificity were 82 and 75.4%, respectively.
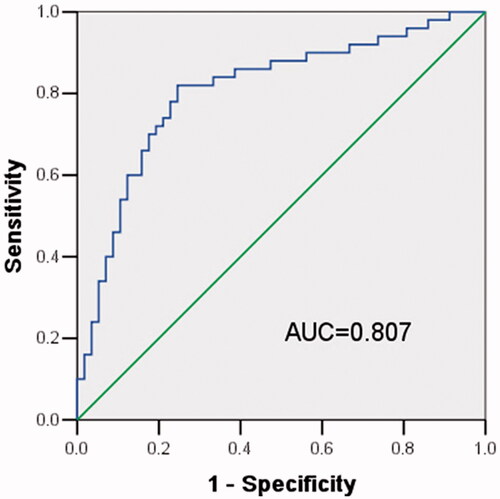
Figure 4. Kaplan–Meier analysis for overall survival of patients with HCC stratified by the expression of X91348. Patients with high X91348 expression lived longer than those with low X91348 expression (Log rank test, p< .001).
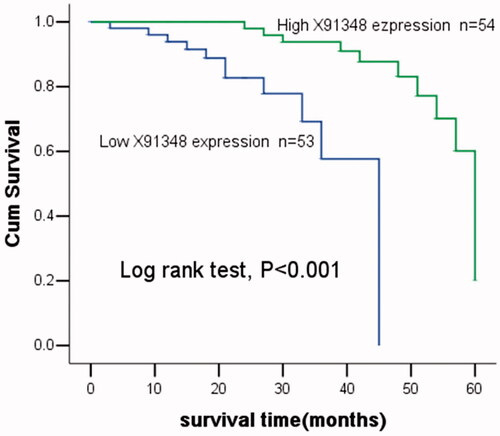
Table 2. Cox regression analysis adjusting for clinical factors to estimate prognostic value of X91348 in HCC.