
Figures & data
Figure 1. Analysis of body weight, blood glucose level and HE staining of retinal ganglion cell in STZ-induced DR rats. (A) Bodyweight; (B) blood glucose level; (C) Representative pictures of H&E staining of retinas. ***p < .001: model versus control; ###p < .001: 12 mg/kg versus model; △△p < .01, △△△p < .001: 6 mg/kg versus model.
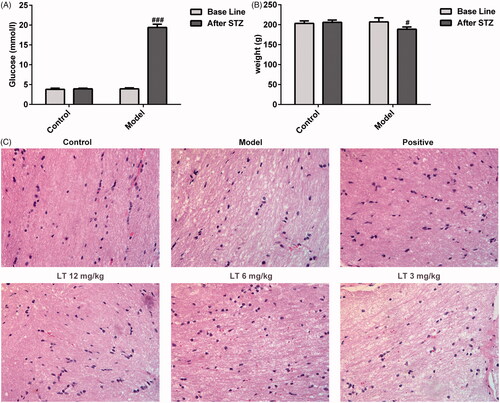
Figure 2. The apoptosis of retinal ganglion cell and the expression of angiogenesis remarks in STZ-induced DR rats. (A) TUNEL staining of retinal ganglion cell and (B) its quantified. (C) Immunofluorescence staining of retinas with CD31, and the enlarged partial view of CD31-stained retina was showed (original magnification ×100). (D) The expression of CD31 was qualified. (E) Immunofluorescence staining of retinas with VEGF, and the enlarged partial view of VEGF-stained retina was showed (original magnification ×100). (F) The expression of VEGF was qualified. ###p < .001 versus control; ***p < .001 versus model; △△p < .01, △△△p < .001 versus positive.
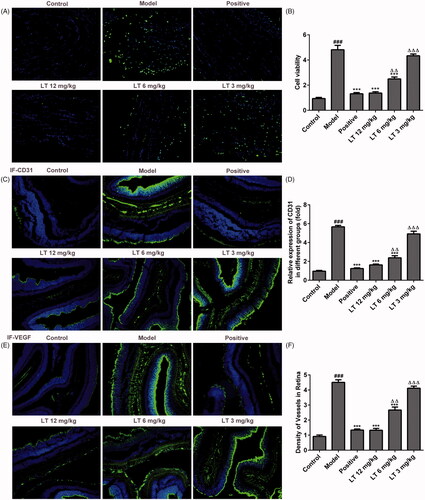
Figure 3. The levels of capillary permeability, anti-inflammation and antioxidant. (A) The level of VEGF in vitreum DR rats. (B) BRB breakdown was detected by using Evans blue leakage assay in STZ-induced DR rats. The levels of (C) TNF-α (D) IL-6 (E) IL-1β in serum of STZ-induced DR rats were measured by Elisa. (F) The level of LDH in HRECs culture supernatant was evaluated using Elisa. (G–I) The expression levels of Nox2 and Nox4 in HRECs were measured by Western blot. ###p < .001 versus control; **p < .01, ***p < .001 versus model; △p < .05, △△p < .01, △△△p < .001 versus positive.
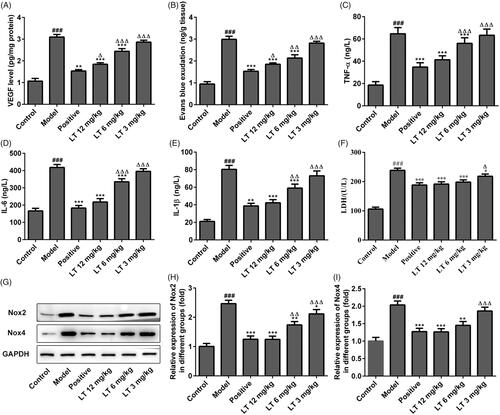
Figure 4. The levels of anti-inflammation, angiogenesis and p38-MAPK/NF-κB signalling pathway in HRECs. The levels of (A) TNF-α (B) IL-6 (C) IL-1β in HRECs were measured by Elisa. The mRNA expression levels of (D) VEGF (E) FLT-1 and (F) KDR were measured by RT-qPCR. (G-K) The protein expression levels of p-p38, p-ERK, p-JNK and NF-κB p65 were evaluated using Western blot. ###p < .001 versus control; *p < .05, **p < .01, ***p < .001 versus model; △p < .05, △△p < .01, △△△p < .001 versus positive.
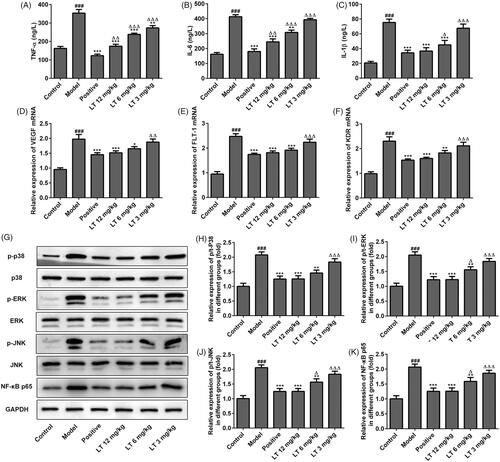
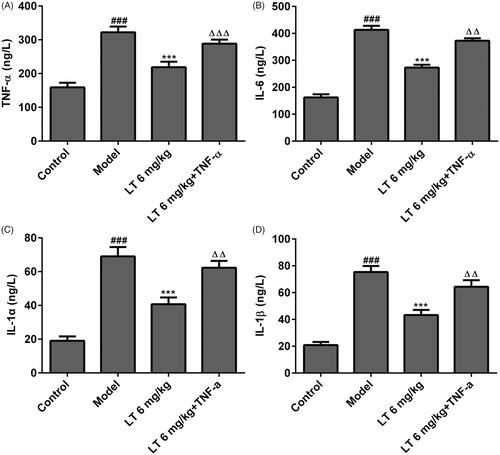
Figure 5. The levels of anti-inflammatory factors after treatment with TNF-α combined with LT in high glucose induced HRECs. The level of (A) TNF-α (B) IL-6 (C) IL-1α and (D) IL-1β were measured by Elisa. ###p < .001 versus control; ***p < .001 versus model; △△p < .01, △△△p < .001 versus LT 6 mg/kg.
Availability of data and materials
The analysed data sets generated during the present study are available from the corresponding author on reasonable request.