Figures & data
Figure 1. The molecular structure of ARB.
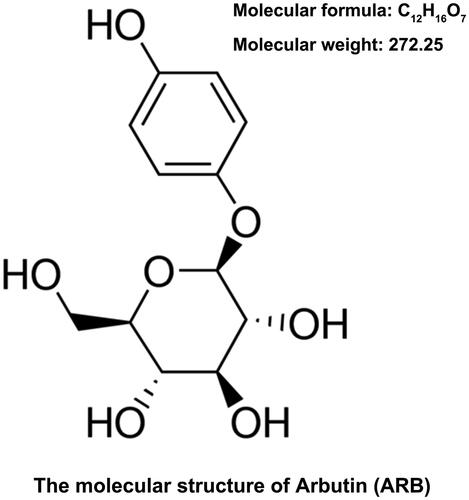
Figure 2. ARB alleviated HG-induced HK-2 cells apoptosis. After administration with (A) high glucose (HG, 45 mM), (B) normal glucose (5.5 mM) and a series of ARB (10, 30 and 50 μM), (C) high glucose (HG, 45 mM) and ARB (10, 30 and 50 μM), cell viability of HK-2 cells by CCK-8 assay assessment. After disposing with high glucose (HG, 45 mM) and 50 μM ARB, (D) cell apoptosis, (E and F) p53, Bcl-2 and Pro/Cleaved-Caspase-3 by flow cytometry and western blot detection. HG vs Control: **p< .01, ***p < .001; HG + ARB vs HG: #p < .05, ##p < .01, ###p < .001; ns: no significant difference.
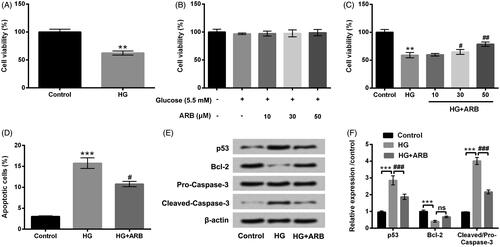
Figure 3. ARB inhibited HG-induced HK-2 cells autophagy. HK-2 cells were disposed with high glucose (HG, 45 mM) and 50 μM ARB, (A) autophagy associated proteins by western blot assessment following with (B) the relative density analysis in HK-2 cells. HG vs Control: ***p < .001; HG + ARB vs HG: ###p < .001; ns: no significant difference.
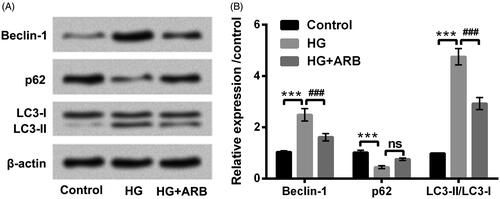
Figure 4. ARB up-regulated miR-27a expression in HG-treated cells. HK-2 cells were stimulated with 5.5 mM or 45 mM glucose as control or HG group, meanwhile treated with ARB (10, 30 and 50 μM). MiR-27a expression by RT-qPCR determination in these treated cells. HG vs Control: ***p < .001; HG + ARB vs HG: ###p < .001; ns: no significant difference.
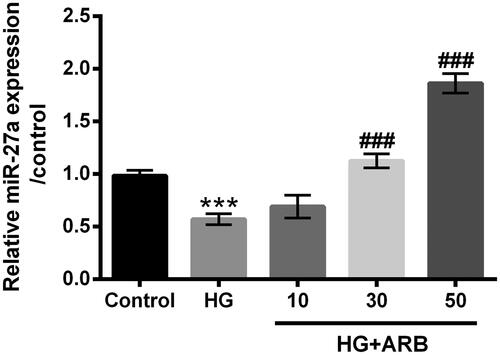
Figure 5. ARB relieved HG-induced HK-2 cells apoptosis and autophagy by mediating miR-27a. (A) MiR-27a inhibitor and NC were respectively transfected into HK-2 cells, miR-27a expression by RT-qPCR assessment in these cells; The transfected cells were disposed with normal glucose (5.5 mM), high glucose (HG, 45 mM), as well as ARB (50 μM). (B) Cell viability, (C) apoptosis, (D and E) p53, Bcl-3, Pro/Cleaved-Caspase-3 expression and (F and G) Beclin-1, p62, LC3-I and LC3-II expression by CCK-8, flow cytometry and western blot assays detection, respectively. MiR-27a inhibitor vs NC or HG vs Control: **p < .01, ***p < .001; HG + ARB vs HG: ###p < .001; HG + ARB + miR-27a inhibitor vs HG + ARB + NC: &&&p < .001; ns: no significant difference.
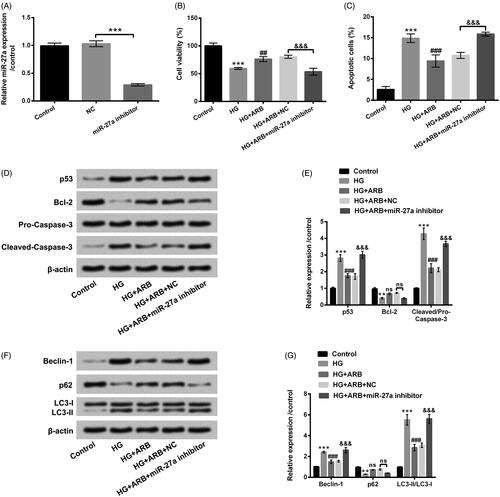
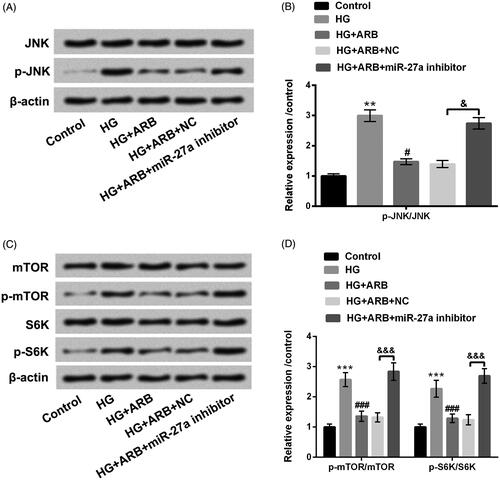
Figure 6. ARB regulated JNK and mTOR-signalling pathways by mediating miR-27a. MiR-27a inhibitor and NC were respectively transfected into HK-2 cells, and these transfected cells were administrated with normal glucose (5.5 mM), high glucose (HG, 45 mM), and ARB (50 μM). (A and B) JNK and p-JNK as well as (C and D) mTOR, p-mTOR, S6K and p-S6K protein levels were assessed by western blot. HG vs Control: **p < .01, ***p < .001; HG + ARB vs HG: #p < .05, ###p < .001; HG + ARB + miR-27a inhibitor vs HG + ARB + NC: &p < .05, &&&p < .001.