Figures & data
Table 1. Sequences of the out-facing primers used in this study.
Table 2. High-throughput RNA sequencing data of rat liver after PHa.
Figure 1. Expression pattern of circRNAs was detected by high-throughput RNA sequencing during the proliferation phase of rat LR. (A) circRNAs detected at each time point in the proliferation phase of LR. (B) The length distribution of circRNAs. (C) Box plots of RPM value of circRNAs. (D) The category of circRNAs. (E) CircRNA distribution on chromosome/scaffold.
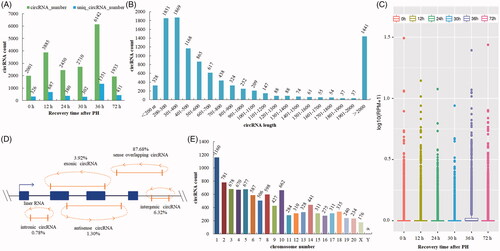
Figure 2. Identification of DE circRNAs in the proliferation phase of LR. (A) Venn analysis of DE circRNAs. (B) Hierarchical cluster analysis and heatmap. (C) The expression situation of DE circRNAs. (D) The distribution of DE circRNAs in different categories.
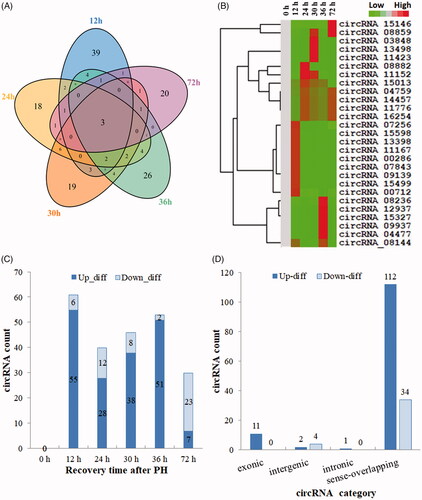
Figure 3. The circRNA–miRNA–mRNA interaction networks. DE circRNAs (green node), their targeted miRNAs (red node) and genes (blue node, involved in cell proliferation) were predicted based on sequence-pairing prediction. The column size was depended on “Number of Directed Edges”.
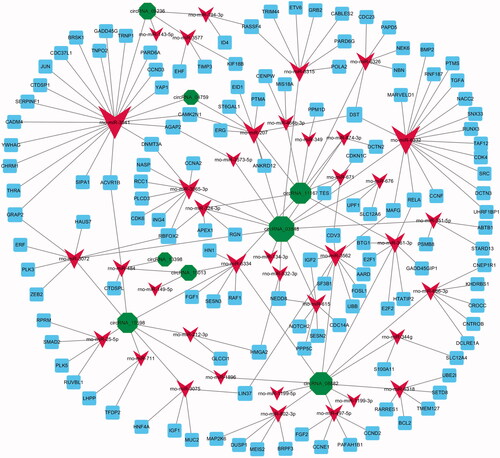
Figure 4. Enrichment analysis of indirectly downstream mRNAs for differentially expressed circRNAs. The GO enrichment analysis of cellular component (A), molecular function (B) and biological process (C). (D) The KEGG pathway enrichment analysis.
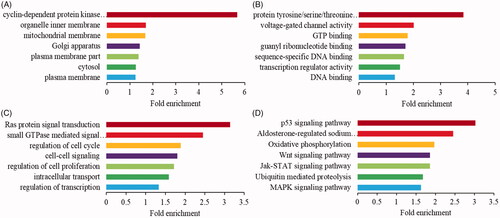
Figure 5. The circRNA–miRNA–mRNA interaction networks and expression profile of the candidate key circRNAs. (A) The candidate key circRNAs and their targeted miRNAs were displayed by green and red node, respectively. (B) DE RNA expression profile of the ceRNA network during the proliferation phase of rat LR. (C) The candidate key circRNAs, their targeted miRNAs and downstream mRNAs were displayed by green, red and blue node, respectively. The column size was depended on “Number of Directed Edges”.
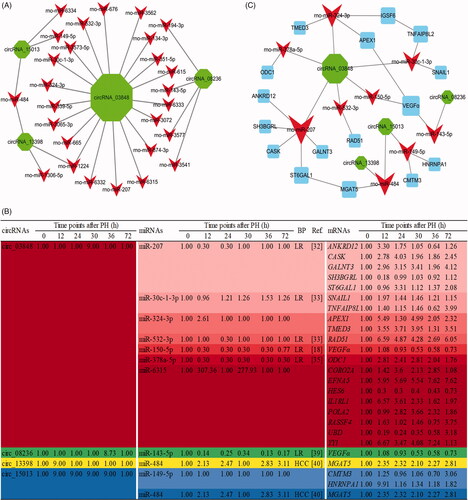
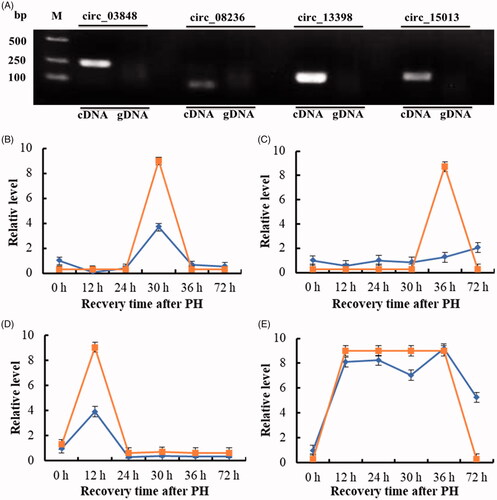
Figure 6. The relative level of four candidate key circRNAs during the proliferation phase of rat LR. (A) Amplification of circRNAs using outward-facing primers with cDNA but not genomic DNA (gDNA). (B) circ_03848. (C) circ_08236. (D) circ_13398. (E) circ_15013. 
 high-throughput sequencing. The infinite was represented by 9 and the infinitesimal was represented by 0.3 for the high-throughput sequencing data.