
Figures & data
Figure 1. Construction of the CD63-GFP plasmid and LV5 lentiviral transfection in bMSC cells. (A) Mouse CD63 lentiviral vector plasmid map. (B) Agarose gel electrophoresis showing the products of LV5-CD63-GFP plasmid restriction digestion. (C) Fluorescence inverted microscopy image of bMSCs infected with the LV5 plasmid. Scale bar = 100 μm. (D) CD63 relative mRNA levels in the CD63-GFP transfected group (LV5 treatment) and the un-transfected negative control (NC) group; n = 3.
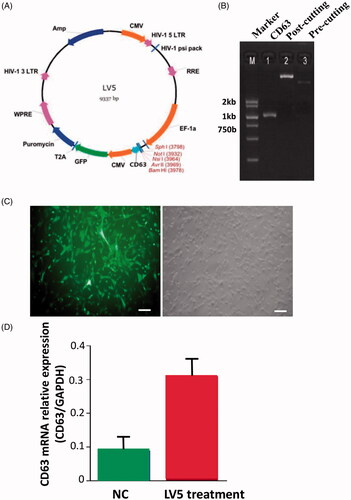
Figure 2. Characterization of exosomes. (A) Puromycin selection of bMSCs expressing CD63-GFP plasmid. Scale bar = 5 μm. (B) Agarose gel electrophoresis. (C) Flow cytometry profiles of paired marker proteins CD44 and CD45. (D) Electron micrograph (EM) profiles showing exosomes in the MSC culture supernatant (left) and control (middle), and a schematic diagram of the distribution of the average diameter of exosomes observed under EM (right). (E) Flow cytometry profiles. (F) Western blot image showing CD63 and Alix expression. CD63-MSC: CD63-MSC cell lysate; CD63-EXO: CD63-MSC exosomes; NC-EXO: NC-MSC exosome (negative control).
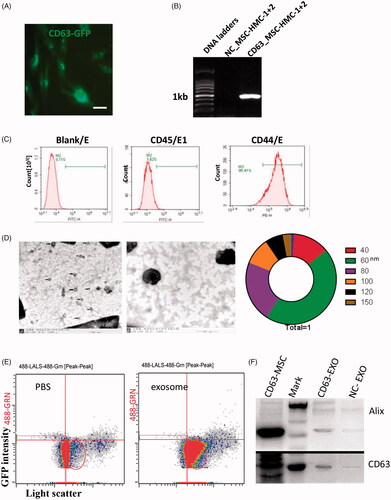
Figure 3. Exosome uptake by SH-SY5Y, BV2, and primary cultured DRG cells in vitro. Confocal laser scanning microscopy images of exosomes (green) derived from bMSCs co-cultured with (A) SH-SY5Y cells or (B) BV2 cells for 24 h, and with DRG cells for 3–36 h. Blue arrows indicate exosomes observed outside the cell membrane; white arrows denote exosomes observed around the cell membrane; and red arrows indicate exosomes that have entered cells. Exosomes were observed in the cytoplasm of (C) glial cells and (D) neurons. (E) Profile showing the change in the transfection rate in DRG neurons and glial cells with culture time. n = 6; Scale bar = 20 μm.
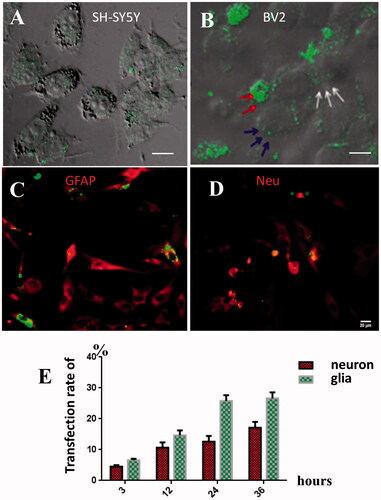
Figure 4. Exosome uptake by DRG cells and motor neurons of the anterior horn of the spinal cord at L5 and L6 segments in vivo. (A1) Open field photo of the DRG; (A2) DAPI staining of the DRG; and (A3) GFP-labeled DRG cells (green); Scale bar = 20 μm. (B) Merged image of A1, A2, and A3. Exosomes surrounding the nuclei of neurons are indicated with the arrowhead; exosomes inside the nuclei of neurons are indicated with the arrow. The bigger box is a zoomed-in image of the smaller box. (C) Profile showing the rate of exosome uptake by DRG glial cells and neurons in vivo. (D) Fluorescence micrographs showing GFP-positive neurons in the bilateral anterior horn of the spinal cord at the L5 and L6 segments on (D1) day 1 and (D2) day 5 after exosome injection. (D3) No GFP-positive neurons were observed in the PBS injection control group. Scale bar = 400 μm. (E) Profile showing the number and the (F) relative fluorescence intensity of neurons containing exosomes at the ipsilateral and contralateral sides of the anterior horn of the spinal cord on day 5 after exosome injection. n = 6. The asterisk indicates comparison with the opposite side,p < 0.01.
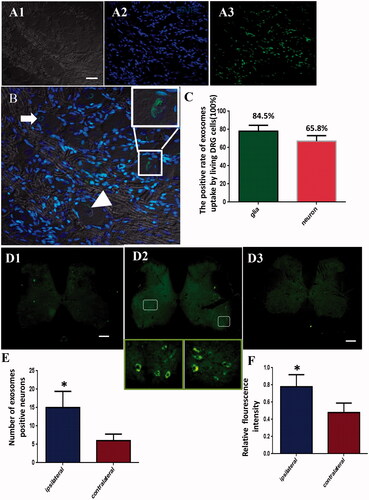
Figure 5. Exosome uptake by peripheral nerve endings and retrograde transport to DRG cells in vivo. Fluorescence micrographs (GFP, left; DAPI, middle; merged, right) showing the (A) ipsilateral side (injection side) of the DRG in a normal rat; (C) DRG section after the ipsilateral sciatic nerve was transectioned prior to exosome injection; and (B, D) contralateral side of the DRG in (B) normal and in a (D) rat where the right sciatic nerve was transectioned, respectively. Scale bar = 20 μm. (E) Profile showing the relative fluorescence intensities of the bilateral DRG in the PBS injection control group (PBS), at day 1 in the exosome injection group (EXO-1d), day 5 in the exosome injection group (EXO-5d), and day 5 in the injection in the ipsilateral sciatic nerve transectioned group (Injured-EXO-5d).
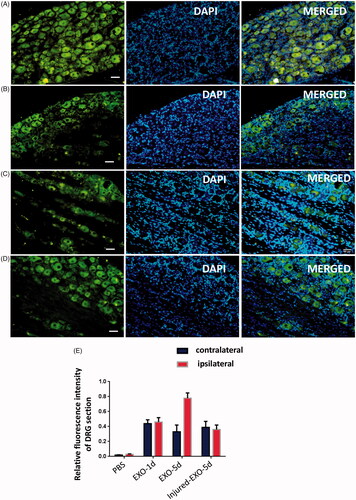
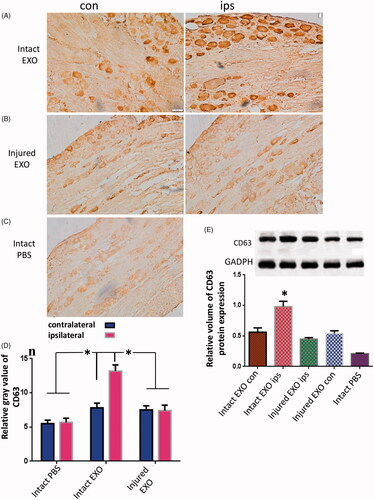
Figure 6. Immunohistochemical and Western blot analysis of CD63 in DRGs after exosome suspension injection. Immunohistochemical images showing the contralateral and ipsilateral sides of the DRG on day 5 (A) before (intact EXO) and (B) after the ipsilateral sciatic nerve was transectioned prior to exosome injection (injured EXO); and (C) the DRG of the PBS injection control group (intact PBS) on day 5 after exosome injection to the right gastrocnemius muscle. (D) Semi-quantitative immunohistochemical profile of the relative gray values of CD63 expression in the intact PBS, intact EXO, and injured EXO groups. n = 6. (E) Western blot image showing the relative CD63 protein expression in the DRGs in the five groups: intact EXO contralateral (con) and ipsilateral (ips) groups; injured EXO con and ips groups; and the intact PBS control group. n = 6. The asterisk indicates comparison with the opposite side and other groups, p < 0.01.
Data availability statement
The datasets generated and analyzed during the present study are available from the corresponding author upon reasonable request.