Figures & data
Table 1. Demographic data of the studied cases and percentage of CD24+ NP cells in each set of experiments.
Figure 1. (A) NP cells show high positive expressions of brachyury T and CD155 either under hypoxic or normoxic expansion. No significant differences were noticed in brachyury T and CD155 expression between normoxic and hypoxic cultivations. On the contrary, the percentage positivity for CD24 in NP cells varied among patients. (B) There was also no correlation between the rates of CD 24 expression and the age of patients.
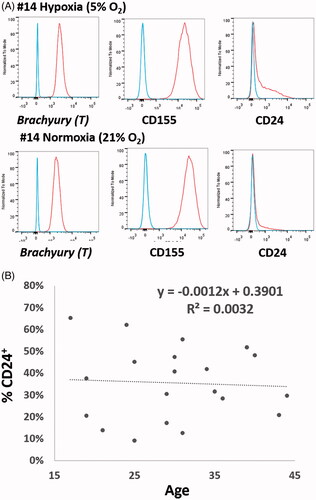
Figure 2. (A) CD24+ and CD24– NP cells were sorted according to CD24 expression. (B) Sorted CD24+ NP cells were pronouncedly stained with CD24 than that of non-sorted cells. (C) There was no significant difference in the growth kinetic between CD24+ and CD24– NP cells. (D) BrdU staining further verified CD24 expression did not influence cell proliferation. (E) NP cells isolated and expanded under hypoxia showed significantly higher rate of CD24 expression than those under normoxia. (F) Serial passages in monolayers caused decreased percentage positivity for CD24 in human NP cells. The percentage positivity for CD24 in P1 NP cells was 43.57 ± 4.81%, 34.17 ± 8.67% in P3 cells and 18.33 ± 5.77% in P5 cells.
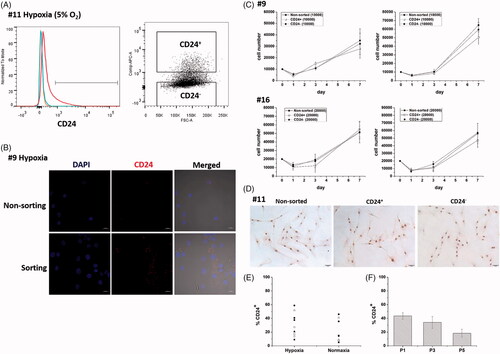
Figure 3. CD24+ NP cells expressed significantly higher levels of ACAN (p < .05), COL2 (p < .001) and COL10 (p < .05), but significantly lower level of MMP-2 (p < .05), MMP-13 (p < .05) and TGF-β1 (p < .05) relative to those of CD24– NP cells. Otherwise, expression levels of DCN, COL1, SOX9, FADD, HIF-1α, –1β and –2α were similar in two groups of cells.
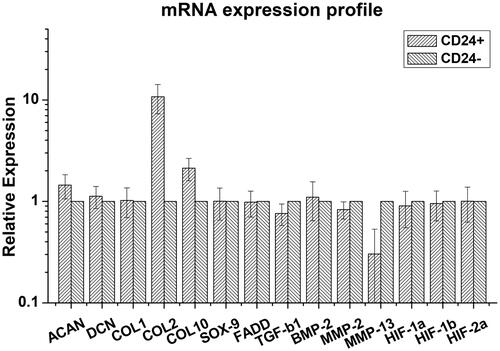
Figure 4. (A) CD24+ NP cells displayed increase in pSer9-GSK-3β levels without substantial changes in the total GSK-3α/β levels (lanes 1 and 2) in parallel with the increase in β-catenin expression (lane 3) compared to CD24– cells. (B) Relative densitometry by Western blotting showed that CD24+ NP cells had significantly higher pSer9-GSK-3β and β-catenin expressions relative to those of CD24– cells.
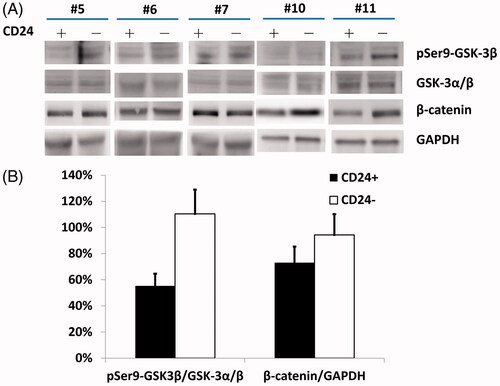
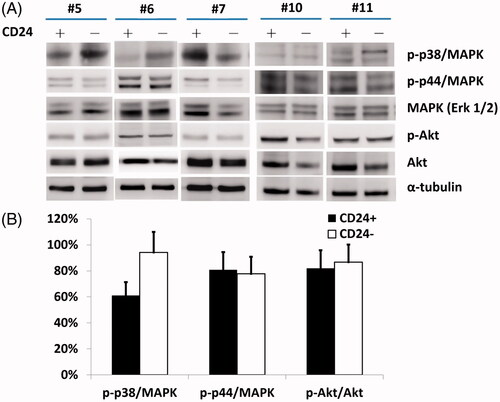
Figure 5. (A) A higher level of p-p38 MAPK with significant difference (B) was noted in CD24– cells compared to CD24+ cells (lane 1). However, there were no substantial changes in the levels of either p-p44/42 MAPK or total MAPK (Erk1/2) proteins (lanes 2 and 3).