Figures & data
Figure 1. ALK restrained cell proliferation and accelerated apoptosis in OSCC cells (A) The viabilities of CAL-27 and SCC-9 cells tested by CCK-8 were investigated after administration with ALK (1, 5, 10, 15 and 20 µM). (B) The percentage of BrdU-positive cells examined by BrdU assay was explored in 10 µM ALK-stimulated cells. (C) Expression of CyclinD1 and p53 assessed by Western blot, (D) cell apoptosis analyzed flow cytometry and (E) protein levels of Bax, Pro-Caspase-3 and Cleaved-Caspase-3 measured by Western blot were all probed in 10 µM ALK-stimulated cells. *p<.05, **p<.01, ***p<.001.
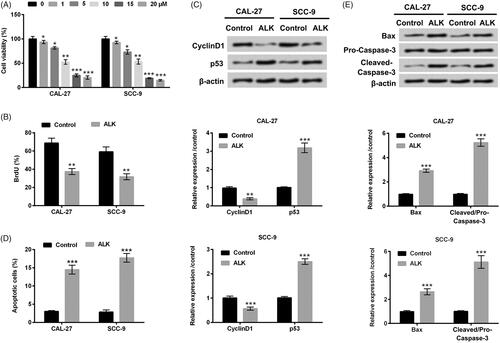
Figure 2. ALK repressed cell migration and invasion in OSCC cells. (A) Cell migration analyzed by Transwell assay was explored in 10 µM ALK-stimulated cells. (B) Cell invasion tested by Transwell assay was investigated in 10 µM ALK-stimulated cells. ***p<.001.
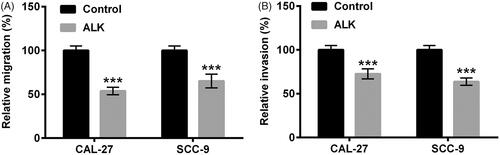
Figure 3. ALK impeded JAK1/STAT3 and PI3K/AKT pathways in OSCC cells. Protein levels of (A–C) total (t)-JAK1, phosphor (p)-JAK1, t-STAT3 and p-STAT3 as well as (D–F) total (t)-PI3K, phosphor (p)-PI3K, t-AKT and p-AKT determined by Western blot were explored in 10 µM ALK-stimulated cells. ***p<.001.
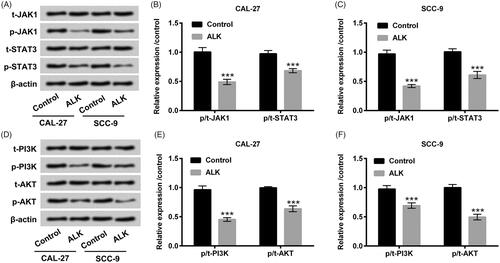
Figure 4. miR-9 expression was enhanced in OSCC tissues but repressed by ALK in OSCC cells. (A) Expression level of miR-9 determined by RT-qPCR was probed in 20 OSCC tissues and the para-carcinoma tissues. (B) Expression level of miR-9 assessed by RT-qPCR was explored in OSCC cell lines after ALK stimulation. ***p<.001.
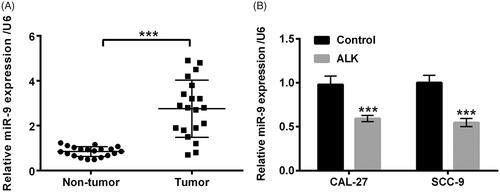
Figure 5. ALK inhibited OSCC cells growth, migration and invasion through repression of miR-9. (A) Expression level of miR-9 determined by RT-qPCR was investigated in OSCC cells after miR-9 mimic transfection. (B) The percentage of BrdU-positive cells tested by BrdU assay, (C and D) expression of CyclinD1 and p53 determined by Western blot, (E) cell apoptosis analyzed by flow cytometry, (F and G) protein levels of Bax, Pro-Caspase-3 and Cleaved-Caspase-3 detected by Western blot, (H) cell migration and (I) cell invasion analyzed by Transwell assay were all probed in OSCC cells after transfection with miR-9 mimic accompanied by ALK stimulation. **p<.01, ***p<.001, ns: no significance.
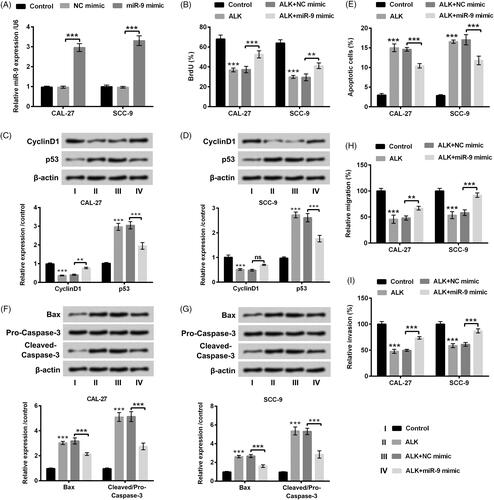
Figure 6. RECK was a novel target gene of miR-9. (A) Expression level of RECK determined by RT-qPCR was explored in OSCC cells after transfection with miR-9 mimic accompanied by ALK stimulation. (B) Protein level of RECK examined by Western blot was investigated in OSCC cells after transfection with miR-9 mimic accompanied by ALK administration. (C) The correlation between RECK and miR-9 tested by dual luciferase activity assay was explored in OSCC cells after RECK-mut and RECK-wt, miR-9 mimic and NC mimic co-transfection. ***p<.001.
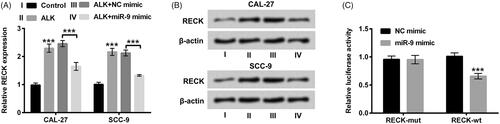
Figure 7. RECK hindered JAK1/STAT3 and PI3K/AKT pathways in OSCC cells. (A) Protein and mRNA expression levels of RECK analyzed by Western blot and RT-qPCR were explored in OSCC cells after transfection with pc-RECK, sh-RECK and the several controls. Protein levels of (B and C) total (t)-JAK1, phosphor (p)-JAK1, t-STAT3 and p-STAT3, likewise (D and E) total (t)-PI3K, phosphor (p)-PI3K, t-AKT and p-AKT determined by Western blot was explored in OSCC cells after transfection with pc-RECK, sh-RECK and the several controls. ***p<.001.
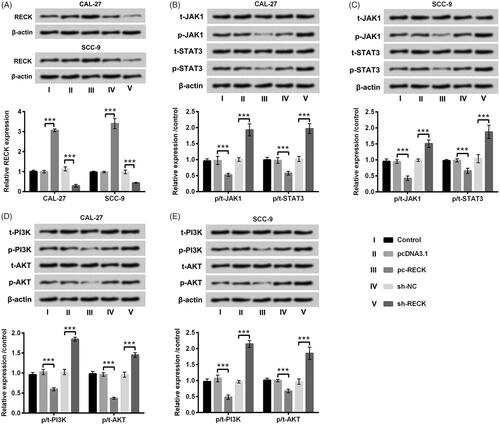
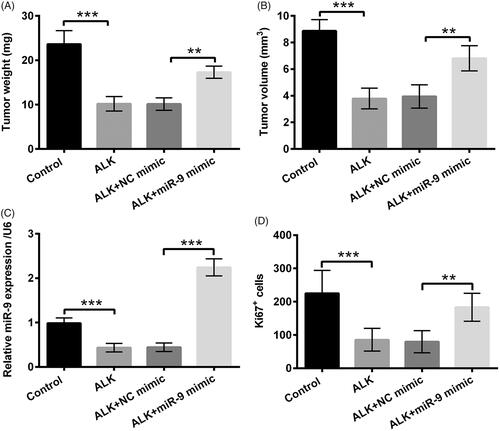
Figure 8. ALK prohibited tumour formation in vivo. The 40 athymic nude mice were assigned into four groups, including Control, ALK, ALK + NC mimic and ALK + miR-9 mimic. Tumor (A) weight and (B) volume were evaluated via xenograft tumours assay. (C) miR-9 expression in above-mentioned experimental group was determined via RT-qPCR. (D) The number of Ki67-positive cells was estimated via immunohistochemistry. **p<.01, ***p<.001.