
Figures & data
Figure 1. Quality target models. Quality targets are shown in colours for the biological variation model (panel A: optimum, desirable, minimum) and with lines for the six sigma-metrics model (panel B: 2–6 σ). Panel C combines both models. The red star represents the Variant II system.
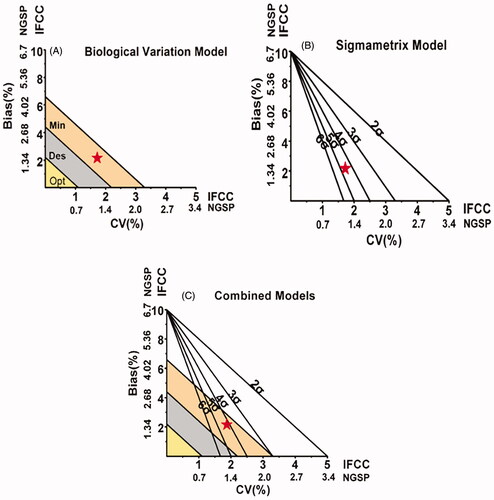
Table 1. The calculation of CV% and bias% for six HbA1c analyzers (1: 6.31% (number MM2068), 2: 9.64% (number MM2121)).
Figure 2. Models applied for five instruments (high and low concentrations).
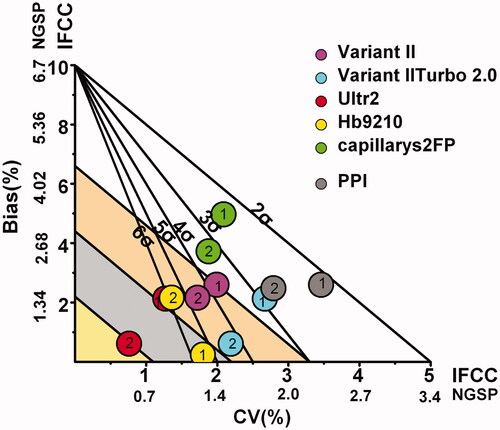
Table 2. σ Values, quality control rules design and quality improvement measures for six HbA1c analyzers (1: 6.31% (number MM2068), 2: 9.64% (number MM2121)).
Availability of data and materials
The datasets used during the present study are available from the corresponding author upon reasonable request.