Figures & data
Table 1. The primer sequence of CaMKIIβ, Cav3.2, Cav3.3 mRNA.
Figure 1. Cell viability of the cells in every group. (± s, n = 8), Compared with normal group, ap < .05, compared with normal + R group, bp < .05, compared with vector + R group, cp < .05.
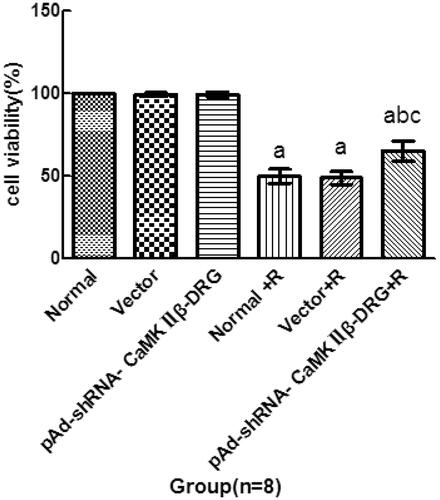
Figure 2. (A) The represented data of cell apoptosis detected by flow cytometry. (B) Apoptosis rate of the cells in every group. (± s, n = 3). Compared with normal group, ap < .05, compared with normal + R group, bp < .05, compared with vector + R group, cp < .05.
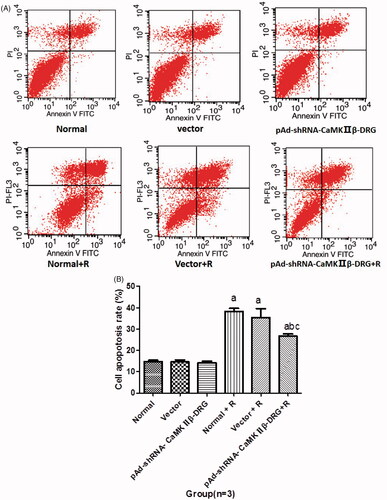
Figure 3. The changes of the cell in every group observed with transmission electron microscope (200 W, 1700×).
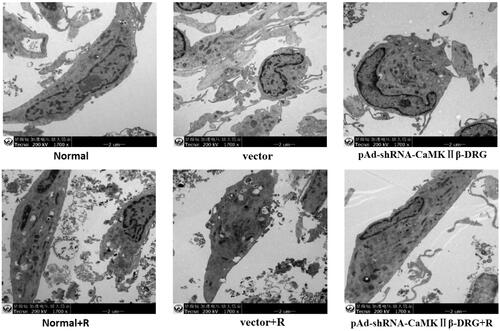
Figure 4. The mRNA expression of CaMKIIβ. (A) Cav3.2 (B) and Cav3.3 (C) ( ± s, n = 6). Compared with normal group, ap<.05, compared with pAd-shRNA- CaMKIIβ-DRG, bp<.05, compared wth normal + R group, cp<.05.
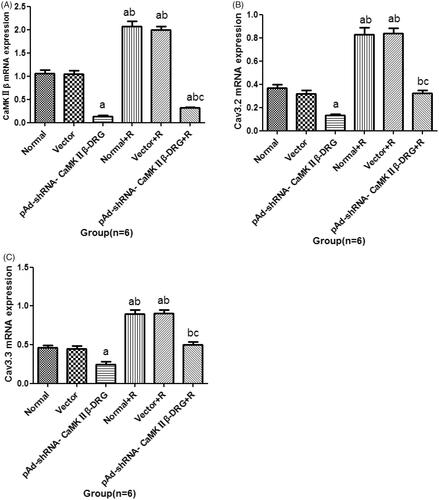
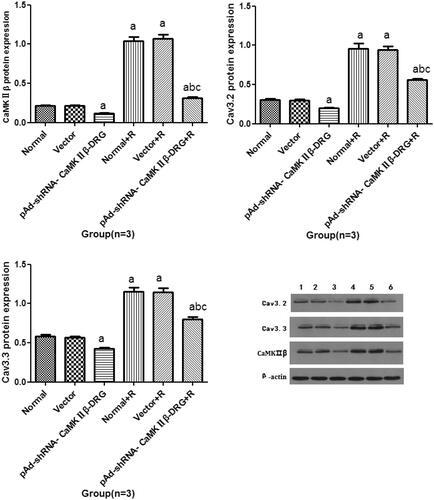
Figure 5. The protein expression of CaMKIIβ (A), Cav3.2 (B) and Cav3.3 (C) protein (± s, n = 3). D: The represented band of every group. Lane 1: normal group; Lane 2: vector group; Lane 3: pAd-shRNA-CaMKIIβ-DRG group; Lane 4: normal + R group; Lane 5: vector + R group; Lane 6: pAd-shRNA-CaMKIIβ-DRG + R group. Compared with normal group, ap < .05, compared with pAd-shRNA-CaMKIIβ-DRG, bp < .05, compared wth normal + R group, cp < .05.