Figures & data
Figure 1. UV-visible spectrum absorption pattern of AuNPs synthesized from MT.
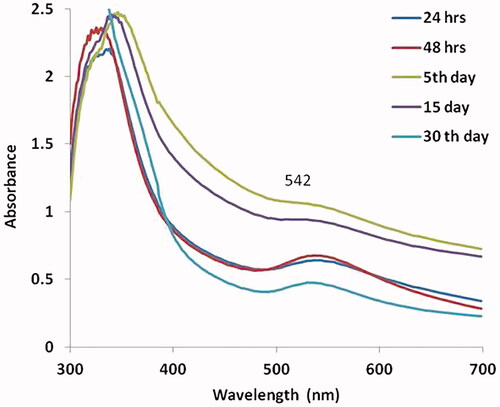
Figure 2. HR-TEM analysis and XRD pattern of AuNPs synthesized from MT.
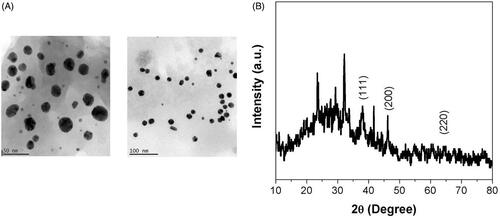
Figure 3. FTIR analysis of AuNPs synthesized from MT.
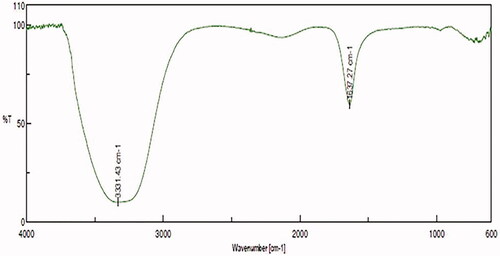
Figure 4. MT-AuNPs inhibit the viability of HepG2 liver carcinoma cells. This experiment was repeated thrice and the bars in the graph represent S.E. (*p<.05).
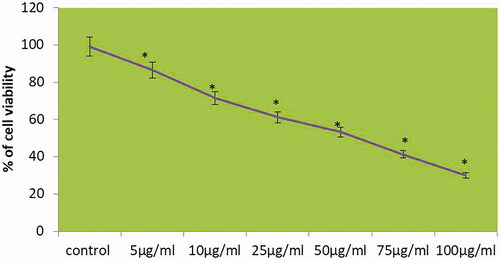
Figure 5. MT-AuNPs inhibit the cell migration of HepG2 liver carcinoma cells.
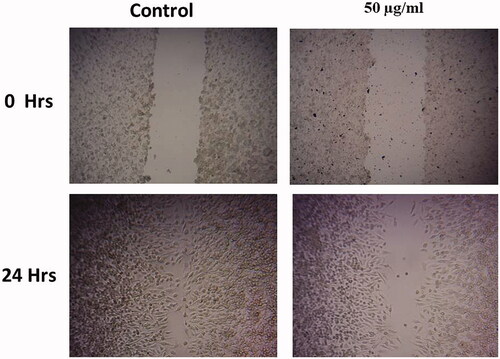
Figure 6. MT-AuNPs induce intracellular ROS generation in HepG2 liver cancer cells.
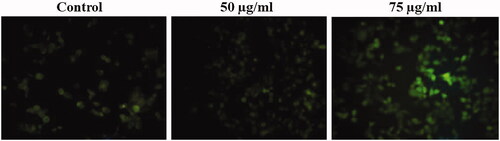
Figure 7. MT-AuNPs changes the MMP in HepG2 liver cancer cells.
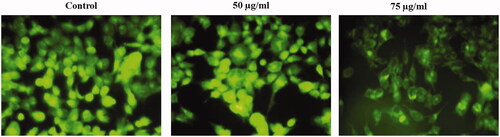
Figure 8. Effect of MT-AuNPs on colorimetric caspase activity in HepG2 liver cancer cells by ELISA method. This experiment was repeated thrice and the bars in the graph represent S.E. (*p<.05, #p<.01).
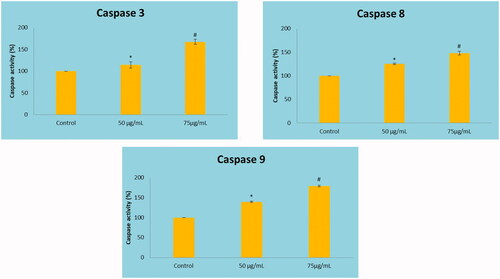
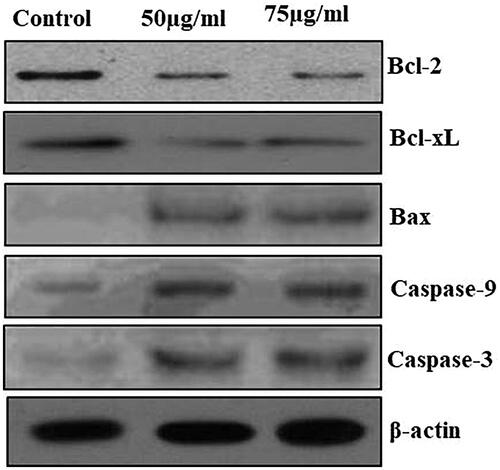
Figure 9. The anticancer effect of MT-AuNPs on apoptotic signaling proteins in HepG2 cell lines were examined by Western blotting technique. The cells were treated with MT-AuNPs (50 and 75 μg) for 24 h and the protein expressions of Bcl-2, Bax, Bcl-XL, caspase-3 and caspase-9 were determined. β-actin was used as a loading control.