Figures & data
Figure 1. UV-visible spectrum absorption pattern and X-ray diffraction analysis of ZnO-NPs synthesized from Allium cepa. UV-VIS absorption spectra of ZnO-NPs. The peak values for UV-VIS, plotted between ZnO-NPs/absorbance ratios. The highest absorbance peak is about 344.00. All solutions were in water. The XRD pattern showed dissimilar concentration peaks in the entire band of 2θ values between range from 25° to 75° for the A. cepa extract. The A. cepa synthesized ZnO-NPs were indexed as 100, 002, 101, 102, 110, 103, 200, 112, 201 and 004. The zinc was indexed and excited at 101 and 100.
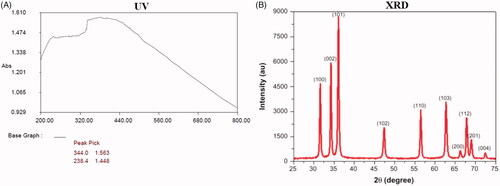
Figure 2. TEM, SEM and EDAX analysis of ZnO-NPs synthesized from Allium cepa. Nanoparticles position in HaCaT cells using TEM. TEM images displayed ZnO-NPs were not originated in the cytoplasm and nucleus of the cells (), but ZnO-NPs were noticed as cumulative disconnected within the cytoplasm as a replacement of single particle after management with 15 μg/mL ZnO-NPs. Allium cepa extract ZnO-NPs were found as nano-shaped (. The organization, segment and form of amalgamated product were examined by the SEM study. The EDAX examination validates peaks for ZnO-NPs. Production and categorization of ZnO nanoparticles using the leaf extract of A. cepa, the EDS spectrum displays the high value of zinc (82.2%) and oxygen (19.68%).
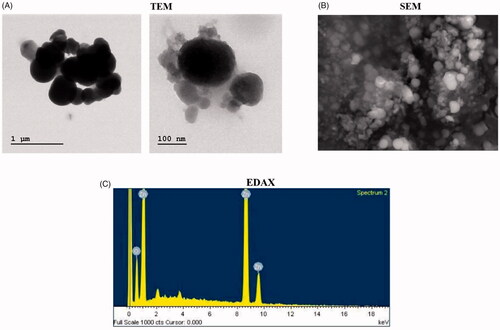
Figure 3. FTIR spectra of ZnO-NPs synthesised from Allium cepa. Allium cepa extract were answerable for the configuration of a variety of nanoparticles. The FTIR range of A. cepa illustrated several assimilation peaks ranged from 3420cm−1 to 500cm−1. shows the representative FT-IR spectra obtained from A. cepa.
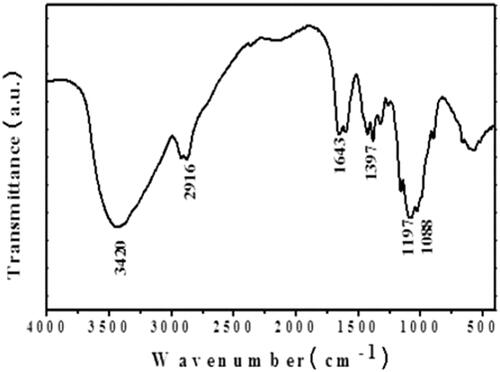
Figure 4. Cytotoxicity results of ZnO-NPs synthesized from Allium cepa. The cell viability assay for normal HaCaT cells were first analyzed in concentration dependent manner (5–50 μg/ml) in which the increased viability was normalized in 15 μg/ml. Subsequently, HaCaT cells were uncovered to ZnO-NPs (0.9–20 lg/ml) for 12 h. The MTT results established as concentration dependent cytotoxicity following exposure to ZnO-NPs ().
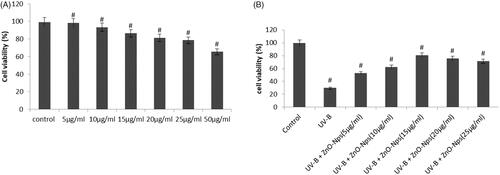
Figure 5. (A) Inside the cell ROS generation was précised by DCFH-DA: (B)Fluorescence images of apoptotic morphology by dual staining (AO/EtBr): (C) Effect of Allium cepa on mitochondrial membrane potential (MMP). DCF fluorescence when measured qualitatively as well as quantitatively (). Group I normal shows no reactive oxygen species formation. UVB irradiated (180 mJ/cm2) group II shows elevated ROS formation. ZnO nanoparticles (15 μg/ml) along with pretreatment of UVB illustrates declined ROS. ZnO-NPs results in a dose-dependent decline in the number of viable cells and also augments in early apoptotic, late apoptotic, and necrotic cells (). Control group is near normal and does not show much colour change. Group II exposed with UVB radiation displayed declined viable cells that too necrotic cells. In addition, group III UVB+ Allium cepa extract of 15 μg/ml ZnO-NPs normalized number of viable cells which was comparable with the control. The control cells discharge high concentration of green fluorescence which represents polarized mitochondria membrane (). On the other hand, ZnO-NPs treated HaCaT cells were demonstrated noteworthy modification of ΔΨM which was frequently diminished green fluorescence shows in .
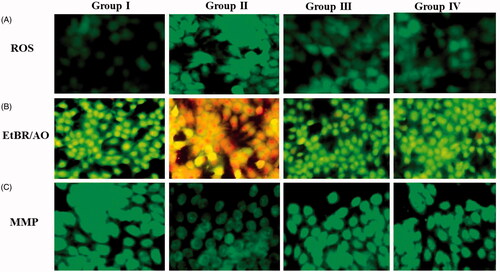
Figure 6. ZnO-NPs of Allium cepa treatment of inflammatory markers in HaCaT cells. shows the ZnO-NPs of Allium cepa action of inflammatory markers, in which UVB irradiated group II, demonstrates high-flying expressions of TNF-α, IL-6, and IL-10. In difference, ZnO-NPs of Allium cepa pampered groups III (15 μg/ml) equivalent pre-treatment with Allium cepa along with UVB display reduced graph results of TNF-α, IL-6, and IL-10.
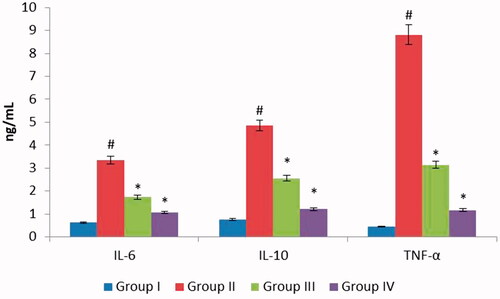
Figure 7. ZnO-NPs augment SOD/CAT/GPx and TBARS activity. UVB irradiation somewhat improved the gene expression level of these antioxidant enzymes as contrast to untreated cells. Conversely, ZnO-NPs pretreated along with UVB radiation cells demonstrated faintly amplified expression of CAT and GPx along with a remarkable elevation in the expression of SOD. On the other hand, treatment with UVB alone cells did not show any momentous outcome on the expression level of these enzymes (). Thiobarbituric acid reactive substances were normal in graph. UVB irradiated (alone) group II displayed elevated level of TBARS. In, contrast UVB irradiated along with ZnO-NPs shows recovered TBARS levels.
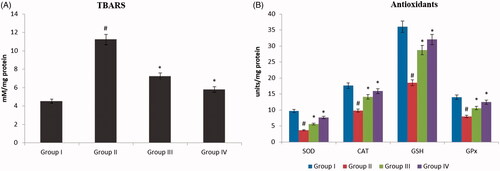
Figure 8. Investigation of apoptotic and signaling proteins. showed modulation of Bax and Bcl2 protein expression levels with an augment in Bax levels and an equivalent decline in Bcl2. A noteworthy enhance in COX-2 and iNOS at the same time ZnO-NPs along with pretreated UVB recovered the apoptotic and other signaling molecules like COX-2 and iNOS.
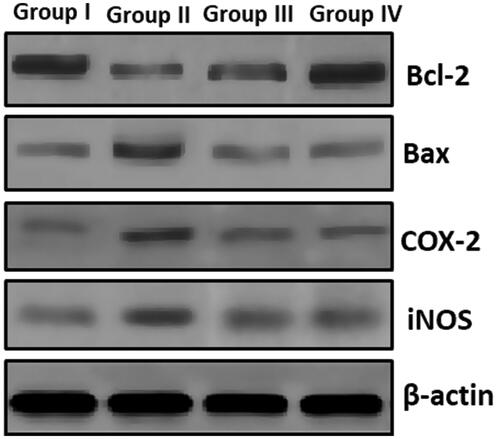
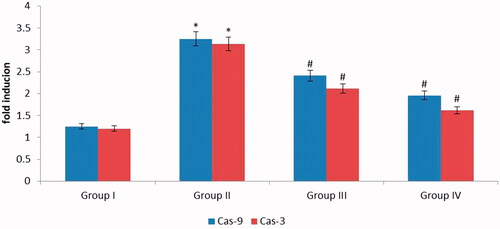
Figure 9. Apoptotic signaling cascade molecules. Similarly, the cascade molecules like caspase-9&3 exhibit the same as contrast with apoptotic signaling cascade molecules which was depicted in . Beta-actin treated as standard marker.